


概述
| canvas | svg | |
| 画布 | canvas标签 | svg标签 |
| 语言 | JS的API | HTML行内属性 |
| 过程 | 定点:确定起点,拐点,终点 连线:连曲线(连圆弧)、连直线 填色:填充颜色 | |
| 进一步 | 画文字,画图片 画矩形,画椭圆 | |
SVG
画直线
| line(画一条线) | x1:起点横坐标 y1:起点纵坐标 x2:终点横坐标 y2:终点纵坐标 stroke-width:线的厚度 stroke:线的颜色 |
| polygon(画多边形) | points:需要连接的各个点 fill:填充颜色 fill-opacity:填充透明度 stroke-width:边框厚度 stroke:边框颜色 |
| polyline(画多段线) | points:需要连接的各个点 fill:填充颜色 fill-opacity:填充透明度 stroke-width:边框厚度 stroke:边框颜色 |
| path(画路径) | ...... |
画曲线
| circle(画圆) | cx:圆心横向偏移量 cy:圆心纵向偏移量 r:半径 fill:填充颜色 fill-opacity:填充透明度 stroke-width:边框厚度 stroke:边框颜色 stroke-opacity:边框透明度 |
| ellipse(画椭圆) | cx:圆心横向偏移量 cy:圆心纵向偏移量 rx:横向半径 ry:纵向半径 fill:填充颜色 fill-opacity:填充透明度 stroke-width:边框厚度 stroke:边框颜色 stroke-opacity:边框透明度 |
rect(画矩形)
- x:横向偏移量
- y:纵向偏移量
- width:宽
- height:高
- fill:填充颜色
- fill-opacity:填充透明度
- stroke-width:边框厚度
- stroke:边框颜色
- stroke-opacity:边框透明度
- rx:矩形圆角
- ry:矩形圆角
Canvas
创建对象
<canvas width="500px" height="500px" id="box"></canvas>
const box=document.getElementById('box')
const ctx=box.getContext('2d')
画直线
- moveTo(x,y):确定新的起点
- lineTo(x,y):确定拐点
- beginPath():开启新的线段
- closePath():闭合路径
- stroke():从最近的beginPath处,进行连直线
- lineWidth():线的宽度
- strokeStyle():线的颜色
- fill():填色
- fillStyle():填充的颜色
画线过程
- 找到beginPath,找到stroke(),找到其中的moveTo(x,y),lineTo(x,y)
- 连接moveTo(x,y)起点、lineTo(x,y)拐点
- 连线的宽度由当前ctx的lineWidth决定
- 连线的颜色由当前ctx的strokeStyle决定
画圆弧(画曲线)
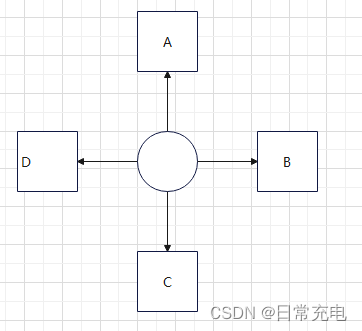
- r:圆的半径
- x,y:圆心坐标
- start值是0π:起始点是B(start默认是0π)
- start值是0.5π:起始点是C;
- start值是-0.5π:起始点是A
- stop:确定终点位置(同start)
- 弧长:start -stop;start=-0.5π,stop=0.5π,弧长为π
- arc(x,y,r,start,stop):连曲线
- fill():填色
- fillStyle():填充的颜色
- 采用顺时针连线
- 单位:度(π=360度)
填充矩形
- fillRect(x,y,width,height):填充出一个矩形
- x:矩形左上角横坐标
- y:矩形左上角纵坐标
- width:矩形宽度
- heght:矩形高度
- fillStyle:填充颜色
画、填充文字
- fillText(text,x,y):填充文字
- strokeText(text,x,y):画文字
画图片
基本用法
- drawImage(Img,x,y)
- drawImage(Img,x,y,width,height)
- drawImage(Img,cutX,cutY,cutWidth,cuttHeight,x,y,width,height)
- Img的类型:HTMLImageElement、HTMLCanvasElement、HTMLVideoElement
- x,y:图片在canvas上的起始位置
- width,height:图片在canvas上的宽高
- cutX、cutY:裁剪图片的起始位置
- cutX、cutY:裁剪图片的宽高
进阶
- 重复的绘制图片,就可以实现视频效果、游戏动画效果
API
- canvas.toDataURL(MIME):生成DataURL字符串
- ctx.clearRect(起始x,起始y,width,height):清空指定区域的画布内容
Base64编码
- 功能:把二进制数据转换成字符串
- 编码方式:二进制数据每6位一组,每组转换成对应的Base64字符串
- DataURL的格式:data:[MIME];base64,[base64字符串]
- img标签支持格式:DataURL、本地URL、网络URL
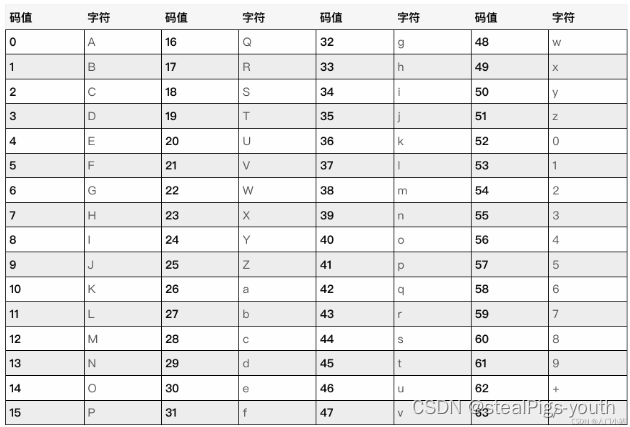
Base64编码对应表
还有渐变、组合、变形等,不赘述了
Echarts
创建对象
<div id="main" style="width: 600px;height:400px;"></div>
const myChart = echarts.init(document.getElementById("main"))
const options={……}
myChart.setOption(options)
options
- title:一段文字配置
- legend:图例配置,展示的数据可以是图表名、单条数据名
- xAxis:x坐标轴配置
- yAxis:y坐标轴配置
- grid:echarts容器与坐标轴的边距
- series:图表配置
- dataset:图表数据集
- radiusAxis:极坐标系-圆半径坐标轴
- angleAxis:极坐标系-360°圆弧坐标轴
- graphic:可以进行自行绘制
- yAxis的第一项默认与series的第一项关联
- 距离单位:数字 || 百分比 || "left" || "center" || "right" || "top" || "bottom" || "middle"
- rich:文本样式配置
- 极坐标系采用的series采用柱状图
yAxis
- type:坐标轴类型,value(数值轴)、category(类目轴)、time(时间轴)、log(对数轴)
- name:坐标轴名称
- nameLocation:坐标轴名称的位置
- axisLine:坐标轴轴线
- axisTick:坐标轴刻度线
- axisLabel:坐标轴每个刻度值的样式
- splitLine:坐标轴分隔线,即与坐标轴刻度线平齐的那条线
- position:坐标轴位置 "right" || "left"
series
共性
- type:图表类型,折线图、柱状图、饼图
- name:图表名称
- data:图表数据
pie图
- left:饼图相对echart容器水平中心线左侧的距离
- right:饼图相对echart容器水平中心线右侧的距离
- top:饼图相对echart容器垂直中心线顶部的距离
- bottom:饼图相对echart垂直中心线容器底部的距离
- label:每条数据的标签名配置
- radius: [内圆尺寸,外圆尺寸]
bar图
- itemStyle:单个柱子的样式
legend
- data:图表名/饼图数据名的数组
- icon:图点形状
- left:图例相对echart容器左侧的距离
- right:图例相对echart容器右侧的距离
- top:图例相对echart容器顶部的距离
- bottom:图例相对echart容器底部的距离
- orient:布局方向
- textStyle:文字样式
坐标系
- 直角坐标系:点的位置由它在水平x 轴和垂直y 轴上的坐标值确定,通常表示为 (x, y)
- 极坐标系:点的位置由它到原点的距离(极径 r)和该点与参考方向之间的夹角(极角 θ)确定,通常表示为 (r, θ)
HTML5标签引入SVG
svg、jpg、png都是图片的类型
代码
<body>
    <img src="./文件.png" style="..." />
    <img src="./文件.svg" style="..."  />
    <svg t="1687932035351" class="icon" viewBox="0 0 1024 1024" version="1.1" xmlns="http://www.w3.org/2000/svg" p-id="892" xmlns:xlink="http://www.w3.org/1999/xlink" width="200" height="200">
        <path d="M909.312 463.189333L520.533333 658.773333 115.370667 463.189333H39.594667v492.202667c0 36.864 30.037333 67.242667 67.242666 67.242667h811.008c37.205333 0 67.242667-30.037333 67.242667-67.242667V463.189333h-75.776z m0 0" fill="#0086FF" p-id="893">
        </path>
        <path d="M853.333333 0.341333H171.008c-37.205333 0-67.242667 30.037333-67.242667 67.242667v317.44l11.605334 5.461333 167.936 81.237334 237.226666 114.688 227.669334-114.688 161.109333-81.237334 11.264-5.461333v-317.44A67.584 67.584 0 0 0 853.333333 0.341333z m-116.053333 390.144H301.056V301.056H737.28v89.429333z m0-167.594666H301.056V133.12H737.28v89.770667z m0 0" fill="#9BD5F9" p-id="894">
        </path>
    </svg>
</body>
目录
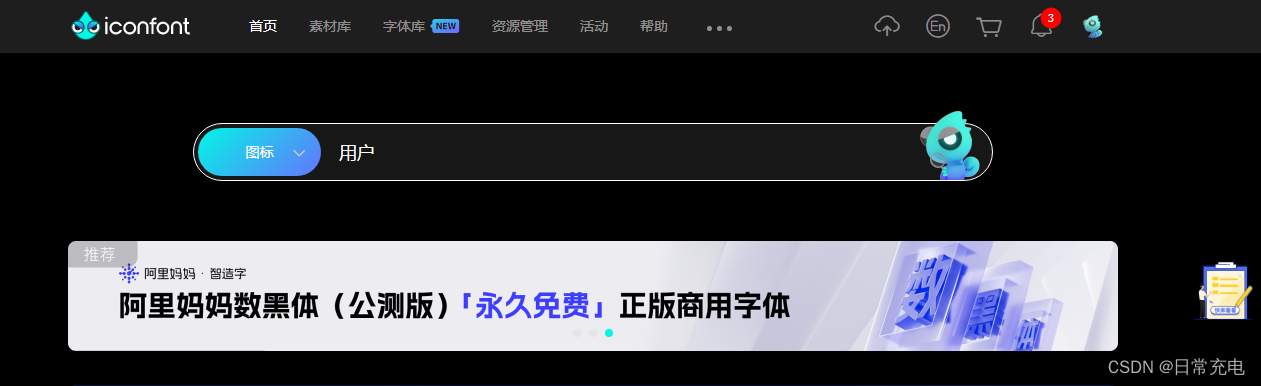
效果图

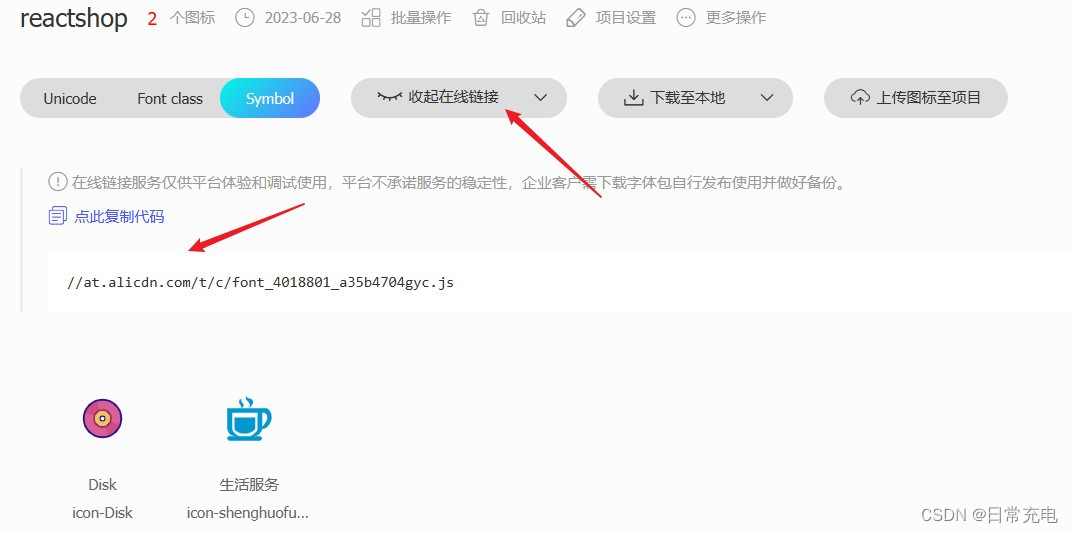
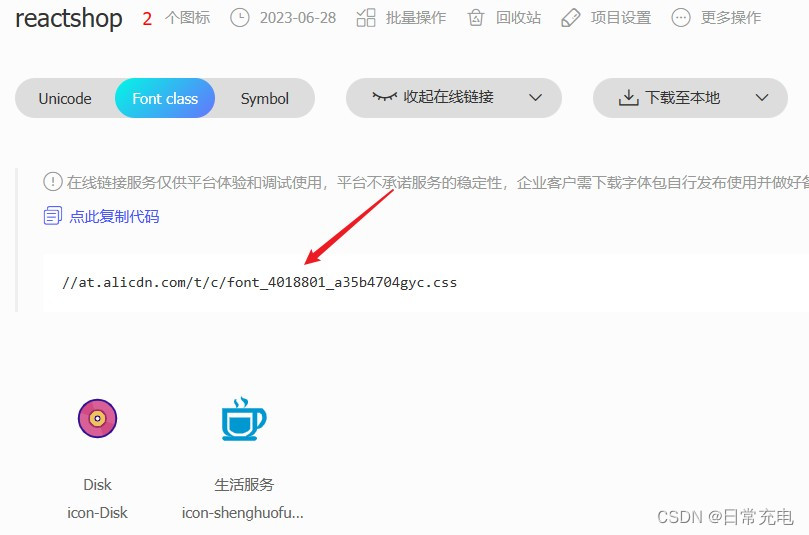
阿里巴巴帮助引入svg
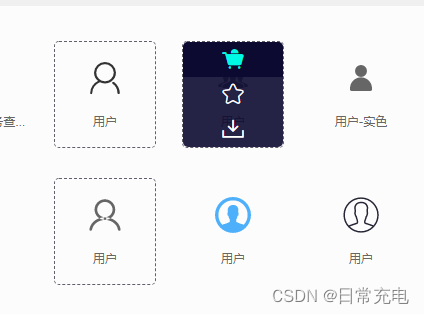
搜送图标
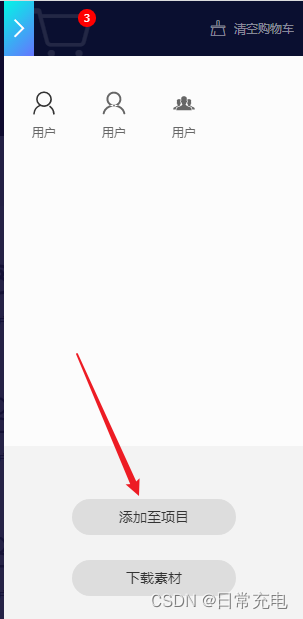
添加到购物车
添加图标至项目
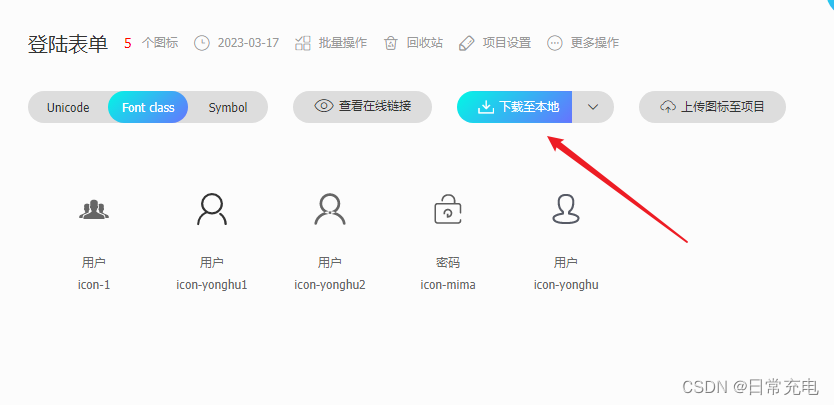
下载图标到本地
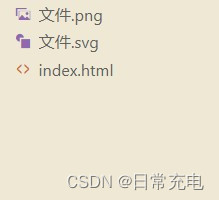
下载的文件目录
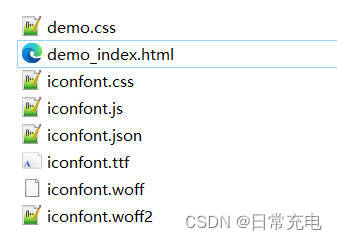
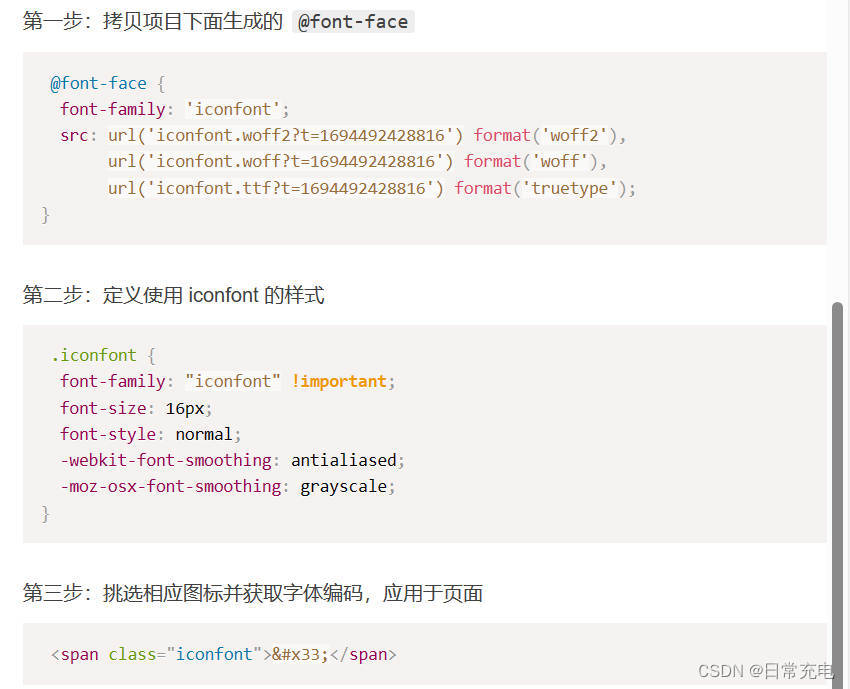
unicode使用
- iconfont.tff、iconfont.woff、iconfont.woff2
- iconfont.css
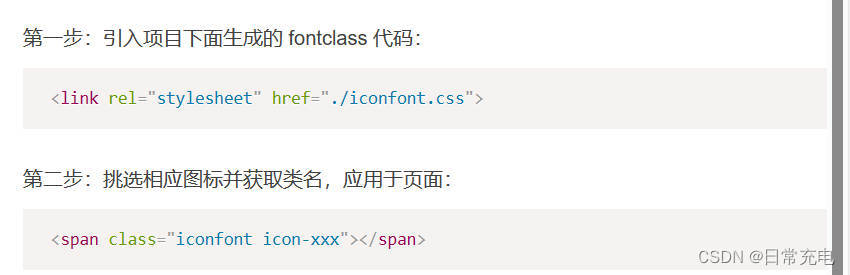
font-class使用
- confont.tff、iconfont.woff、iconfont.woff2
- iconfont.css
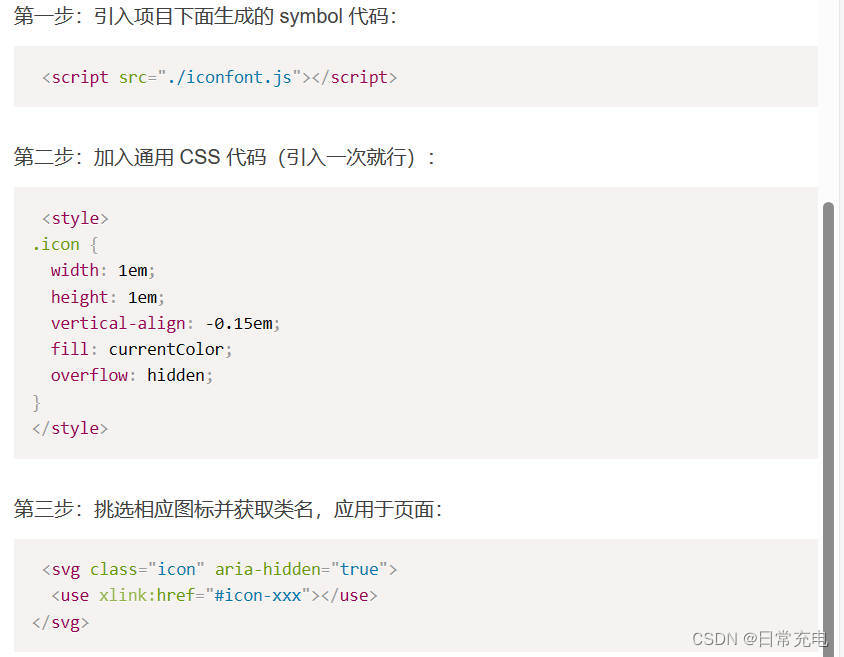
symbol使用
- iconfont.js
更新的svg图标
- 点击在线链接生成新的iconfont.css、新的iconfont.css
- Font class下有新的iconfont.css
- Symbol class下有新的iconfont.js
- 新的iconfont.css、iconfont.js替换旧的iconfont.css、iconfont.js
ElementPlus自带图标库
配置
//vite.config.js
import AutoImport from 'unplugin-auto-import/vite'
import Components from 'unplugin-vue-components/vite'
import { ElementPlusResolver } from 'unplugin-vue-components/resolvers'

export default defineConfig({
  plugins: [
    AutoImport({
      resolvers: [ElementPlusResolver()],
    }),
    Components({
      resolvers: [ElementPlusResolver()],
    }),
  ]
}
使用
用法1
//main.js
import * as ElementPlusIconsVue from '@element-plus/icons-vue'
const app = createApp(App)
for (const [key, component] of Object.entries(ElementPlusIconsVue)) {
  app.component(key, component)
}

<el-icon :size="20" :color="color"><HomeFilled /></el-icon>
<HomeFilled style="..." />
<el-button icon="HomeFilled" />
<component is="HomeFilled" />


用法2
import {HomeFilled} from '@element-plus/icons-vue'

<el-icon :size="20" :color="color"><HomeFilled /></el-icon>
<HomeFilled style="..." />
<el-button :icon="HomeFilled" />
<component :is="HomeFilled" />
Ant Design自带图标库
5.2.5版本,按需引入图标即可
import {UserOutlined} from "@ant-design/icons"

<UserOutlined />


 975
975


 被折叠的 条评论
为什么被折叠?
被折叠的 条评论
为什么被折叠?
 到【灌水乐园】发言


