


%信号与系统第一次作业
%% 绘制基本波形
Fs = 1000; % 采样频率,单位为Hz
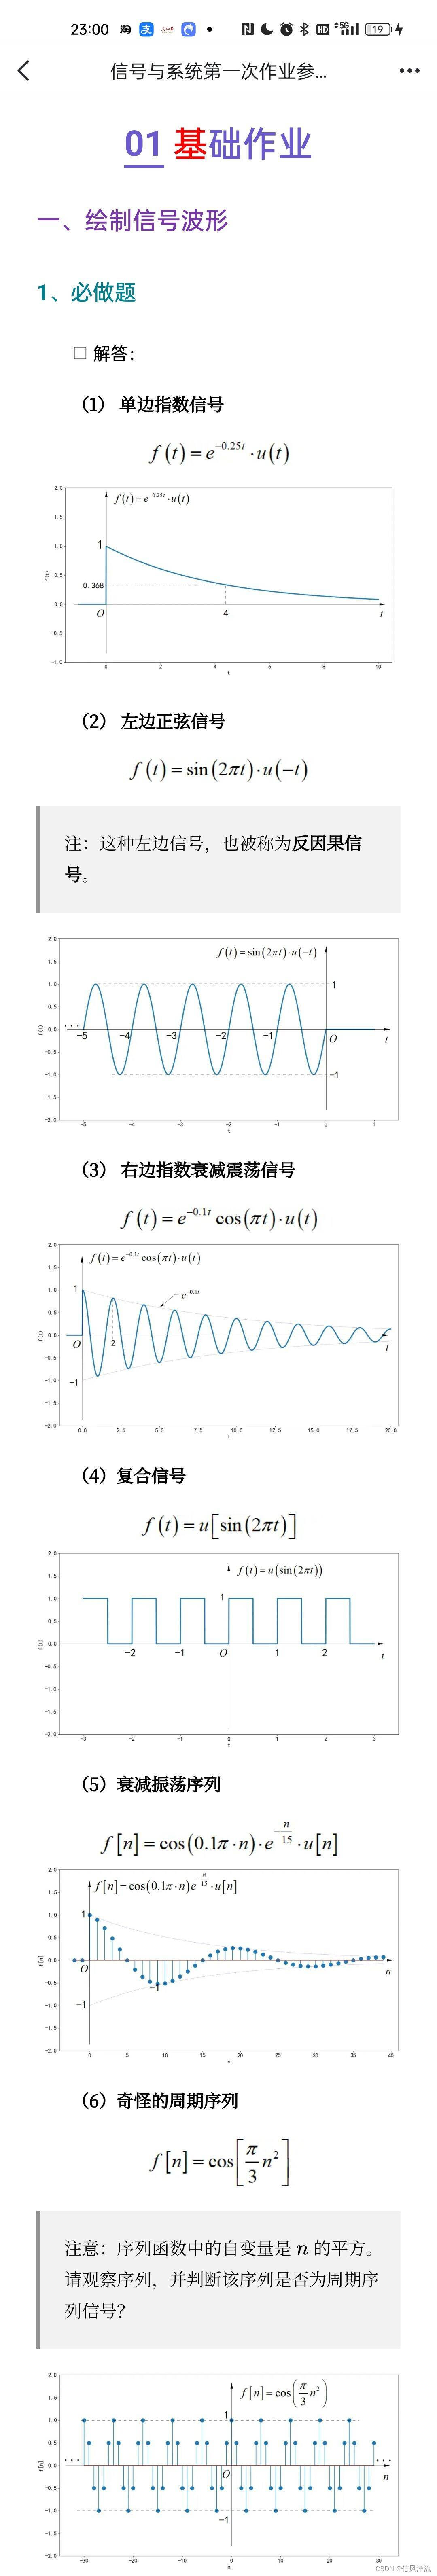
%1、单边指数信号
t = -2:1/Fs:10-1/Fs;
y1=exp(-0.25*t).*heaviside(t)
figure(1);
plot(t,y1);
%2、左边正弦信号
t=-10:1/Fs:1-1/Fs;
y2=sin(2*pi*t).*heaviside(-t);
figure(2);
plot(t,y2);
%3、右边指数衰减震荡信号
t=-1:1/Fs:20-1/Fs;
y3=exp(-0.1*t).*cos(pi*t).*heaviside(t);
figure(3);
plot(t,y3);
%4、复合信号
t=-8:1/Fs:8-1/Fs;
y4=heaviside(sin(2*pi*t));
figure(4);
plot(t,y4);
%5、衰减震荡序列
n=0:40;
y5=cos(0.1*pi*n).*exp(-n/15).*heaviside(n);
figure(5);
stem(n,y5,"filled");
%6、奇怪的周期序列
n=-30:30;
y6=cos(pi/3*n.*n);
figure(6);
stem(n,y6,"filled");
``


 1万+
1万+


 被折叠的 条评论
为什么被折叠?
被折叠的 条评论
为什么被折叠?
 到【灌水乐园】发言


