t=0:0.01:10;
x=sin(t);
plot(x);
n=-3:4;
x=[-3 2 -1 2 1 -1 2 3];
stem(n,x,"filled");
xlabel('n');
title('X(n)');
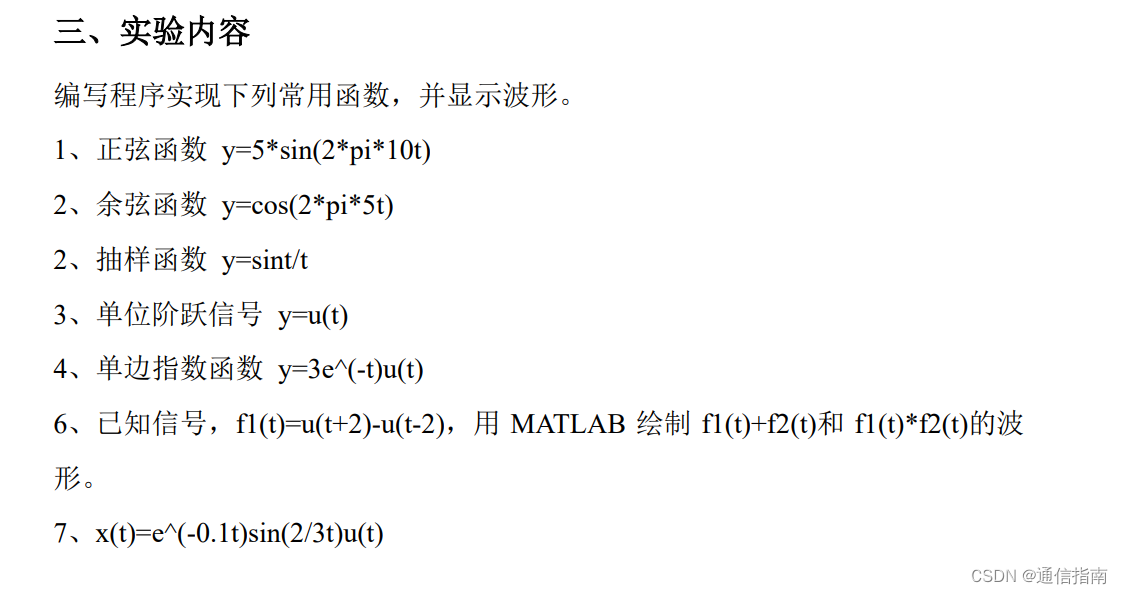
t=-0.1:0.001:0.1;
y1=5*sin(2*pi*10*t);
figure(1);
plot(t,y1);
t=-0.3:0.001:0.3;
y2=cos(2*pi*5*t);
figure(2);
plot(t,y2);
t=-50:0.01:50;
y3=sin(t)./t;
figure(3);
plot(t,y3);
t=-1:0.01:1;
y4=heaviside(t);
figure(4);
plot(t,y4);
t=-10:0.01:10;
y5=3.*exp(-t).*heaviside(t);
figure(5);
plot(t,y5);
t=-5:0.1:5;
f1=heaviside(t+2)-heaviside(t-2);
figure(6);
subplot(1,3,1);
plot(t,f1);
subplot(1,3,2);
plot(t,f1+f1);
subplot(1,3,3);
k=2*length(t)-1;
k3=linspace(2*t(1),2*t(end),k);
plot(k3,conv(f1,f1));
t=-5:0.01:5;
x=exp(-0.1*t).*sin(2/3*t).*heaviside(t);
figure(7);
plot(t,x);


 3667
3667


 被折叠的 条评论
为什么被折叠?
被折叠的 条评论
为什么被折叠?
 到【灌水乐园】发言


