


先看样式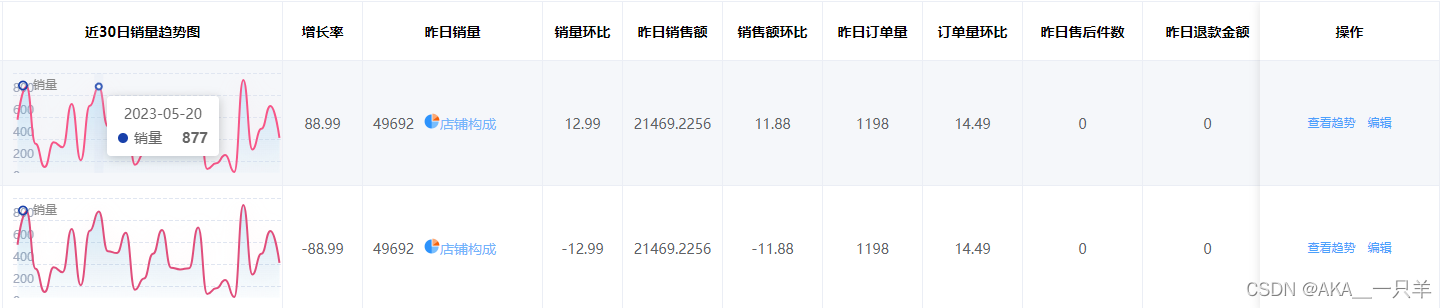 安装ECharts: 通过npm或者直接引入ECharts的CDN来进行安装。如果使用npm安装,可以使用以下命令:
npm install echarts
-
创建Vue组件: 创建一个Vue组件来包裹表格和ECharts折线图。在该组件中,需要引入ECharts组件。
-
在表格中插入ECharts: 通过自定义插槽或其他方式,在表格中插入ECharts折线图。
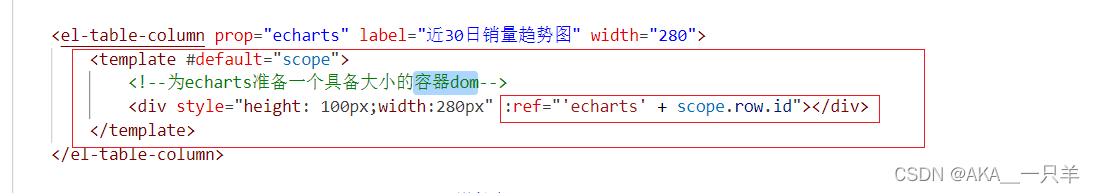
            <el-table :data="tableData" style="width: 100%" border :header-cell-style="tableHeaderCellStyle"
                :cell-style="tableCellStyle" @cell-click='changecolor' @row-click='handleRowClick'>
                <el-table-column type="index" label="序号" width="60"></el-table-column>
                <el-table-column label="商品信息" width="220" show-overflow-tooltip sortable>
                    <template slot-scope="scope">
                        <div class="shop_box">
                            <div class="shop_img">
                                <el-image style="width: .75rem; height: .75rem;" :src="scope.row.img"
                                    :preview-src-list="scope.row.srcList">
                                </el-image>
                            </div>
                            <div class="shop_tit" style="width: .75rem;float: left;">
                                <p>商品名称:{{ scope.row.name }}</p>
                                <p>商品编码:{{ scope.row.shop_id }}</p>
                                <p>{{ scope.row.title }}</p>
                            </div>
                        </div>
                    </template>
                </el-table-column>
                <el-table-column prop="colors" label="颜色规格" width="180"></el-table-column>
                <el-table-column prop="inventory" label="库存"></el-table-column>
                <el-table-column prop="Replenishornot" label="是否补货"></el-table-column>
                <el-table-column prop="Suggestrestocking" label="建议补货"></el-table-column>
                <el-table-column prop="yesterday" label="昨日毛利率" width="100"></el-table-column>

                <el-table-column prop="echarts" label="近30日销量趋势图" width="280">
                    <template #default="scope">
                        <!--为echarts准备一个具备大小的容器dom-->
                        <div style="height: 100px;width:280px" :ref="'echarts' + scope.row.id"></div>
                    </template>
                </el-table-column>

                <el-table-column prop="growthrate" label="增长率"></el-table-column>
                <el-table-column prop="Yesterdayssalesvolume" label="昨日销量" width="180">
                    <template slot-scope="scope">
                        <div class="shop_box">
                            <div class="" style="margin-right: .125rem;">
                                {{ scope.row.Yesterdayssalesvolume }}
                            </div>
                            <div class="" style="color: #6db3fd;" @click="StoreComposition">
                                <img width="16" height="16"
                                    src="https://images.sursung.com/dis/11201370/20221230/front/B9C3C8966B2140C09EFE0874E7F6C651_s781_h32_w32.png">店铺构成
                            </div>
                        </div>
                    </template>
                </el-table-column>
                <el-table-column prop="Salesmonthonmonth" label="销量环比"></el-table-column>
                <el-table-column prop="salesvolume" label="昨日销售额" width="100"></el-table-column>
                <el-table-column prop="Salesvolumemonthonmonth" label="销售额环比" width="100"></el-table-column>
                <el-table-column prop="Yesterdaysordervolume" label="昨日订单量" width="100"></el-table-column>
                <el-table-column prop="Orderquantitymonthonmonth" label="订单量环比" width="100"></el-table-column>
                <el-table-column prop="Yesterdaysaftersalesquantity" label="昨日售后件数" width="120"></el-table-column>
                <el-table-column prop="Yesterdaysrefundamount" label="昨日退款金额" width="130"></el-table-column>
                <el-table-column prop="Refundrate" label="近14天支付退款率" width="180"></el-table-column>
                <el-table-column fixed="right" label="操作" width="180">
                    <template slot-scope="scope">
                        <el-button @click="handleClick(scope.row)" type="text" size="small">查看趋势</el-button>
                        <el-button type="text" size="small">编辑</el-button>
                    </template>
                </el-table-column>
            </el-table>
在表格中为echarts准备一个容器dom,注意点我这里使用的是id来绑定图表只要是唯一属性皆可
-
mounted钩子函数:当组件被挂载时调用,里面调用了init方法和getEcharts方法。 -
methods区块:包含了init和getEcharts两个方法。init方法初始化了表格的数据,而getEcharts方法使用 ECharts 绘制图表。 -
ECharts 图表:通过
echarts.init初始化图表,然后设置图表的样式、数据等属性,最后通过myChart.resize()监听窗口大小变化并调整图表大小。
mounted() {
this.init()
},
methods: {
init() {
this.tableData = [
{
id: '1',
name: '居家日用',
//模拟数据
},
{
id: '2',
name: '可口可乐短罐',
//模拟数据
}
];
//调用echarts
this.getEcharts()
},
getEcharts() {
setTimeout(_ => {
this.tableData.forEach(e => {
let myChart = echarts.init(this.$refs['echarts' + e.id]);
const xAxisData = [
"2023-05-11",
"2023-05-12",
"2023-05-13",
"2023-05-14",
"2023-05-15",
"2023-05-16",
"2023-05-17",
"2023-05-18",
"2023-05-19",
"2023-05-20",
"2023-05-21",
"2023-05-22",
"2023-05-23",
"2023-05-24",
"2023-05-25",
"2023-05-26",
"2023-05-27",
"2023-05-28",
"2023-05-29",
"2023-05-30",
"2023-05-31",
"2023-06-01",
"2023-06-02",
"2023-06-03",
"2023-06-04",
"2023-06-05",
"2023-06-06",
"2023-06-07",
"2023-06-08",
"2023-06-09",
"2023-06-10",
];
myChart.setOption({
textStyle: {
fontFamily: "Din-Light",
},
color: [
"#123dac",
"#73e2e2",
"#ff7e85",
"#9b52ff",
"#fac524",
"#46caff",
"#a1e867",
"#10b2b2",
"#ec87f7",
"#f4905a",
"#00baba",
"#facf24",
"#e89d67",
"#23c6c6",
"#fa8699",
"#40b7fc",
"#006d75",
"#595959",
"#f4764f",
"#a640fc",
"#fda23f",
"#2d7ae4",
"#5092ff",
"#9351ed",
"#8a89fe",
"#df89e8",
"#2797ff",
"#6ad089",
"#7c92e8 ",
],
title: {
text: "",
left: "47%",
textStyle: {
fontSize: 24,
},
},
legend: {
data: [
{
name: "销量",
icon: "path://M512 139.81262864a286.42534744 286.42534744 0 1 0 286.42534744 286.42534744 286.42534744 286.42534744 0 0 0-286.42534744-286.42534744z m0 477.3755789a190.95023144 190.95023144 0 1 1 190.95023144-190.95023146 190.95023144 190.95023144 0 0 1-190.95023144 190.95023146z",
},
],
left: "left",
selected: {
销量: true,
},
itemWidth: 10,
itemHeight: 10,
itemGap: 10,
textStyle: {
color: "#898989",
lineHeight: 15,
},
type: "scroll",
},
tooltip: {
trigger: 'axis',
position: function (point, params, dom, rect, size) {
var x = 0; // x坐标位置
var y = 0; // y坐标位置
// 当前鼠标位置
var pointX = point[0];
var pointY = point[1];
// 提示框大小
var boxWidth = size.contentSize[0];
var boxHeight = size.contentSize[1];
// boxWidth > pointX 说明鼠标左边放不下提示框
if (boxWidth > pointX) {
x = pointX + 10;
} else { // 左边放的下
x = pointX - boxWidth - 5;
}
// boxHeight > pointY 说明鼠标上边放不下提示框
if (boxHeight > pointY) {
y = 5;
} else { // 上边放得下
y = pointY - boxHeight;
}
return [x, y];
},
axisPointer: {
type: 'shadow',
crossStyle: {
color: '#999'
}
},
},
grid: {
left: 0,
right: 0,
top: 110,
bottom: 100,
},
xAxis: {
type: "category",
boundaryGap: true,
data: xAxisData,
axisLabel: {
color: "#a0a9bc",
//X轴标签 label 做了特殊处理,防止左右溢出
formatter: (value, index) => {
if (index === 0 || index === xAxisData.length - 1) {
return "";
}
return value;
},
},
axisLine: {
show: false,
},
axisTick: {
show: false,
},
},
yAxis: {
name: "",
nameTextStyle: {
color: "gray",
},
type: "value",
axisLabel: {
color: "#a0a9bc",
inside: true,
margin: 0,
verticalAlign: "bottom",
},
splitLine: {
lineStyle: {
type: "dashed",
},
},
minInterval: 1,
axisLine: {
show: false,
},
axisTick: {
show: false,
},
},
series: [
{
name: "销量",
data: [
575, 877, 356, 145, 370, 326, 718, 207, 702, 877, 517, 500, 684, 167, 268, 493, 708, 367, 351, 362,
731, 127, 179, 254, 100, 936, 305, 493, 701, 410
],
type: "line",
smooth: true,
smoothMonotone: "x",
cursor: "pointer",
showSymbol: false,
lineStyle: {
normal: {
width: 2,
color: "rgba(230, 80, 125)", // 线条颜色
},
borderColor: "rgba(0,0,0,1)",
},
areaStyle: {
//区域填充样式
normal: {
//线性渐变,前4个参数分别是x0,y0,x2,y2(范围0~1);相当于图形包围盒中的百分比。如果最后一个参数是‘true’,则该四个值是绝对像素位置。
color: new echarts.graphic.LinearGradient(
0,
0,
0,
1,
[
{
offset: 0,
color: "rgba(25,163,223,.3)",
},
{
offset: 1,
color: "rgba(25,163,223, 0)",
},
],
false
),
shadowColor: "rgba(250, 195, 202)", //阴影颜色
shadowBlur: 20, //shadowBlur设图形阴影的模糊大小。配合shadowColor,shadowOffsetX/Y, 设置图形的阴影效果。
},
},
},
],
});
window.addEventListener("resize", () => {
myChart.resize();
});
})
}, 1000)
},
}, <el-table-column prop="echarts" label="近30日销量趋势图" width="280">
<template #default="scope">
<!--为echarts准备一个具备大小的容器dom-->
<div style="height: 100px;width:280px" :ref="'echarts' + scope.row.id"></div>
</template>
</el-table-column>


 8092
8092


 被折叠的 条评论
为什么被折叠?
被折叠的 条评论
为什么被折叠?
 到【灌水乐园】发言


