


hold:有保留画布上内容的功能
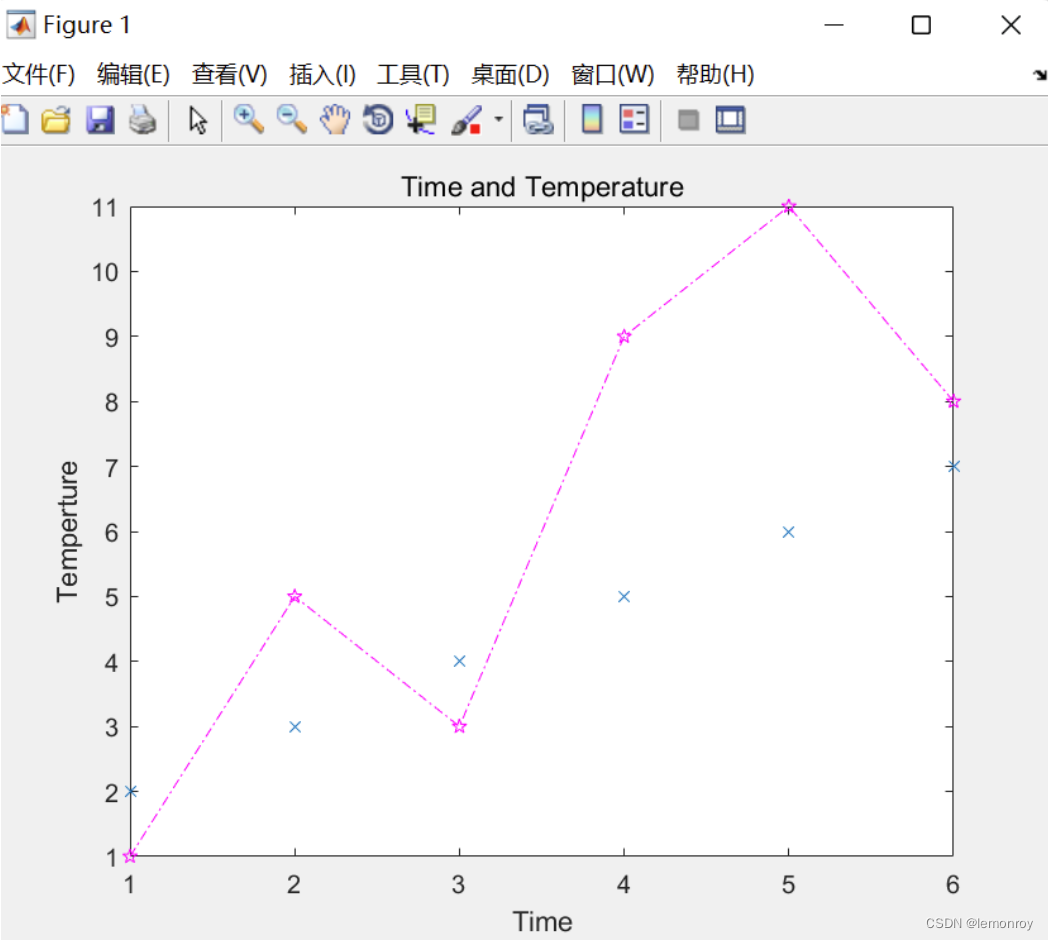
x=1:6;
y=[1 5 3 9 11 8];
plot(x,y,'m-.p');
hold;
plot(x,x+1,'x');
xlabel('Time');
ylabel('Temperture');
title('Time and Temperature')
x=1:6;%hour
y=[1 5 3 9 11 8];%temperture
% ishold=fause擦去画布
plot(x,y,'p');
% plot #1
hold;
%ishold=true保留画布
plot(x,x+1,'x-');
% plot #1+ plot #2
hold;
%ishold=fause擦去画布
plot(x,x+2,'o-');
%plot #3
xlabel('Time');
ylabel('Temperture');
title('Time and Temperature')
hold on:保留画布
hold off:擦去画布
figure():呼叫并产生新的画布
close all:关闭所有画布,从内存上删除,close之后重新唤醒得到一个全新空白画布
注:鼠标点击窗口会导致激活状态改变
clf:清空当前被激活的figure
cla:清空小画布axe(坐标系)
一个figure上可以有很多块小画布(坐标系),每个小画布可以有自己的状态
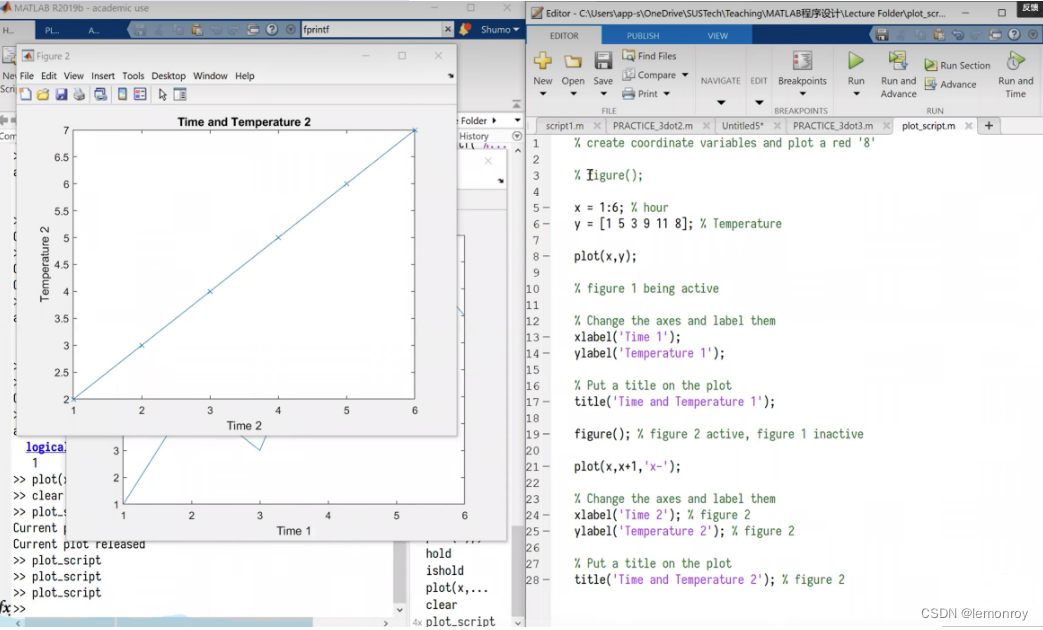
figure 1→figure 2→figure1实例
x=1:6;%hour
y=[1 5 3 9 11 8];%temperture
plot(x,y);
%figure 1 being active
%Change the axes and label them
xlabel('Time 1');
ylabel('Temperture 1');
title('Time and Temperature 1');%figure 1
figure();
plot(x,x+1,'x-');
%Change the axes and label them
xlabel('Time 2');
ylabel('Temperture 2');
title('Time and Temperature 2');%figure 2
figure(1);%figure 1 active,figure 2 inactive
hold on;%ishold = true,on figure 1
plot(x,x+1,'o- ');
figure窗口的状态
不存在的状态
隐藏的状态
存在且激活的状态
存在但不激活的状态
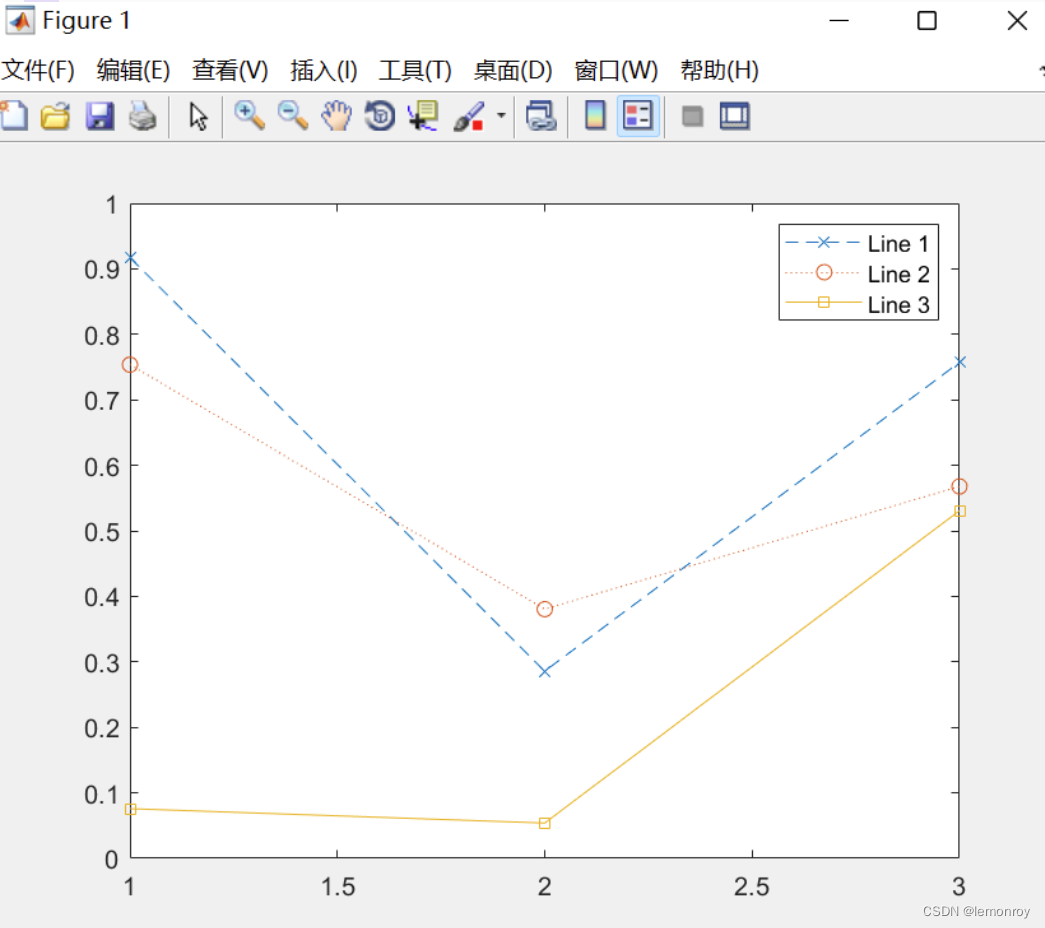
figure
 plot(rand(3,1),'x--')
hold on
plot(rand(3,1),'o:')
plot(rand(3,1),'s-')
grid     %添加网格
grid on
grid off
legend('Line 1','Line 2','Line 3')
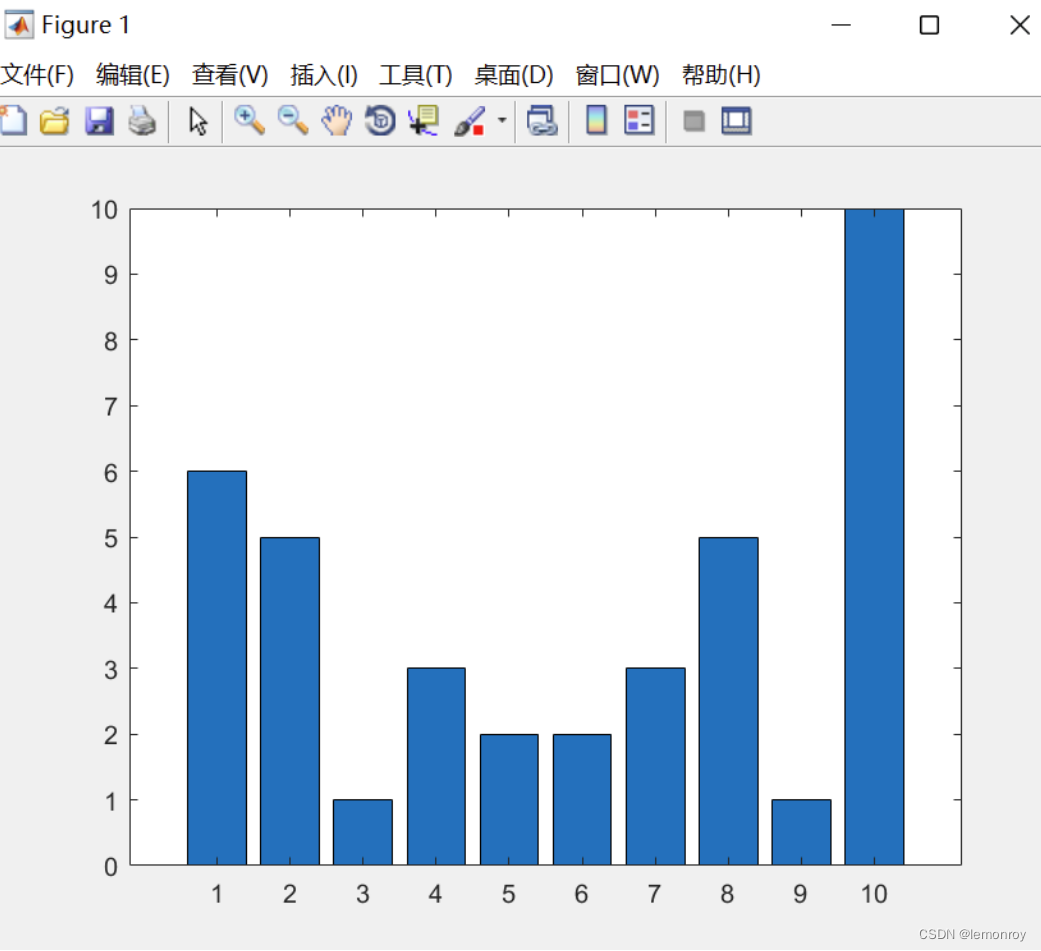
bar(1:10,randi([1,10],[1,10]))
%画柱状图。里面的数字表示横纵坐标的范围,x范围1到10,y范围是1行10列的1到10的随机整数
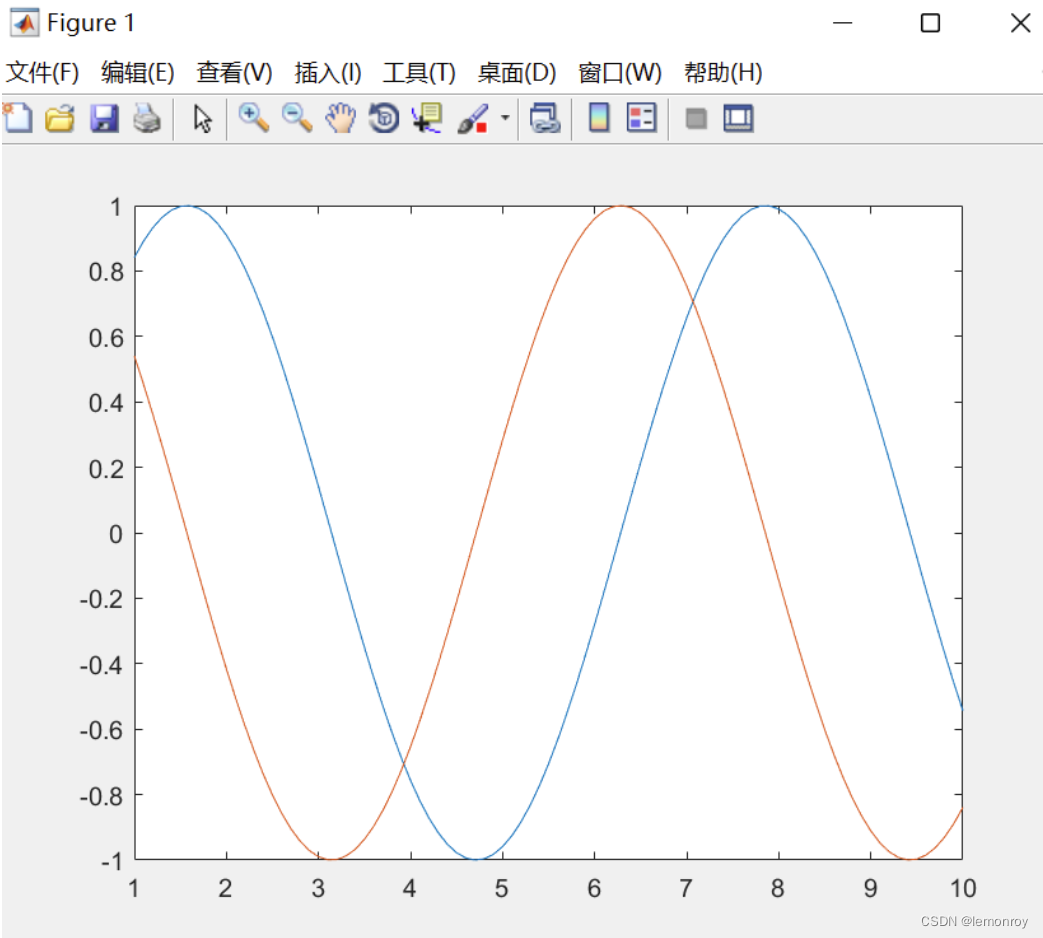
plot(1:0.1:10,sin(1:0.1:10),1:0.1:10,cos(1:0.1:10))


 381
381


 被折叠的 条评论
为什么被折叠?
被折叠的 条评论
为什么被折叠?
 到【灌水乐园】发言


