


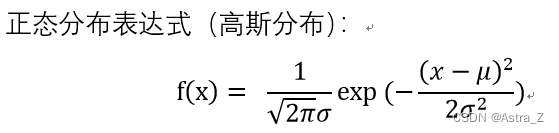
其中:
μ-期望(均值)
σ-标准差
σ2-方差
python代码:
import numpy as np
import matplotlib.pyplot as plt

mu = 0.67
sigma = 0.08
x = np.linspace(mu - 3 * sigma, mu + 3 * sigma, 1000)
NormalDistribution = (1 / (sigma * np.sqrt(2 * np.pi))) * np.exp(-0.5 * ((x - mu) / sigma)**2)
plt.plot(x, NormalDistribution)
plt.axvline(x=mu, color='r', linestyle='--', label='mean')
plt.axhline(y=0, color='b', linestyle='--', label='X=0')
plt.title('Normal Distribution')
plt.xlabel('Value')
plt.ylabel('Probability Density')
plt.legend()
plt.show()
R代码:
mu <- 0
sigma <- 0.33
x <- seq(from = mu - 4*sigma, to = mu + 4*sigma, by = 0.1)
y <- dnorm(x, mean = mu, sd = sigma)
plot(x, y, type = "l", main = "Normal Distribution", xlab = "Value", ylab = "Probability Density")
lines(x, y, col = "red", lwd = 2)
abline(v = 0, col = "blue", lwd = 2)
abline(h = 0, col = "green", lwd = 2)


 1606
1606


 被折叠的 条评论
为什么被折叠?
被折叠的 条评论
为什么被折叠?
 到【灌水乐园】发言


