


文章目录
1.索引对象
1.1 Index索引
1.Series和DataFrame中的索引都是Index对象
df = pd.DataFrame({'month': [1, 4, 7, 10],
                    'year': [2012, 2014, 2013, 2014],
                    'sale':[55, 40, 84, 31]})
se = pd.Series(np.arange(10))
df.index, se.index
运行结果
(RangeIndex(start=0, stop=4, step=1), RangeIndex(start=0, stop=10, step=1))
2.索引对象不可变,保证了数据的安全
df.index[0] = 2

#运算结果:
---------------------------------------------------------------------------
TypeError                                 Traceback (most recent call last)
Cell In[6], line 1
----> 1 df.index[0] = 2

File D:\miniconda3\lib\site-packages\pandas\core\indexes\base.py:5347, in Index.__setitem__(self, key, value)
   5345 @final
   5346 def __setitem__(self, key, value) -> None:
-> 5347     raise TypeError("Index does not support mutable operations")

TypeError: Index does not support mutable operations
1.2 Pandas层级索引
下面创建一个Series, 在输入索引Index时,输入了由两个子list组成的list,第一个子list是外层索引,第二个list是内层索引。
series_obj = pd.Series(
    data=np.random.rand(12),
    index=[['a', 'a', 'a', 'a', 'b', 'b', 'b', 'b', 'c', 'c', 'c', 'c'],
           [0, 1, 2, 3, 0, 1, 2, 3, 0, 1, 2, 3]])
series_obj
运行结果:
a  0    0.675562
   1    0.290974
   2    0.923371
   3    0.528725
b  0    0.705647
   1    0.963255
   2    0.286361
   3    0.119633
c  0    0.506428
   1    0.857414
   2    0.179158
   3    0.493659
dtype: float64
MultiIndex索引对象
- 打印这个Series的索引类型,显示是MultiIndex
- 直接将索引打印出来,可以看到有lavels,和labels两个信息。levels表示两个层级中分别有那些标签,labels是每个位置分别是什么标签。
# 如果index行索引具有嵌套的格式, 那么索引部分就是 MultiIndex 数据类型
series_obj.index
运行结果
MultiIndex([('a', 0),
            ('a', 1),
            ('a', 2),
            ('a', 3),
            ('b', 0),
            ('b', 1),
            ('b', 2),
            ('b', 3),
            ('c', 0),
            ('c', 1),
            ('c', 2),
            ('c', 3)],
           )
- 取值
- 根据索引获取数据。因为现在有两层索引,当通过外层索引获取数据的时候,可以直接利用外层索引的标签来获取。
- 当要通过内层索引获取数据的时候,在list中传入两个元素,前者是表示要选取的外层索引,后者表示要选取的内层索引。
1.外层选取:
print(series_obj['c'])
运行结果:
0    0.319075
1    0.306451
2    0.724069
3    0.509286
dtype: float64
2.内层选取:
print(series_obj[:, 2])
运行结果:
a    0.163087
b    0.968324
c    0.724069
dtype: float64
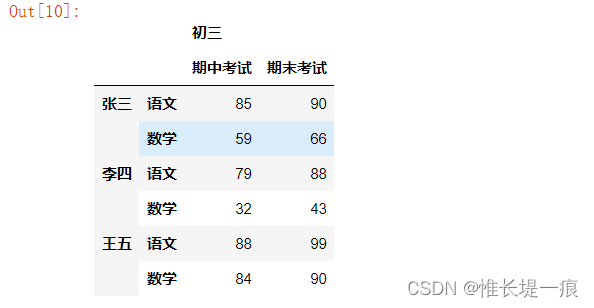
DataFrame层级索引
df = pd.DataFrame(data=[[85, 90], [59, 66], [79, 88], [32, 43], [88, 99],
                        [84, 90]],
                  index=[
                      ['张三', '张三', '李四', '李四', '王五', '王五'],
                      ['语文', '数学', '语文', '数学', '语文', '数学'],
                  ],
                  columns=[['初三', '初三'], ['期中考试', '期末考试']])
df
输出
2 排序操作
2.1 Series排序
- 使用series.sort_values(ascending=True)进行排序
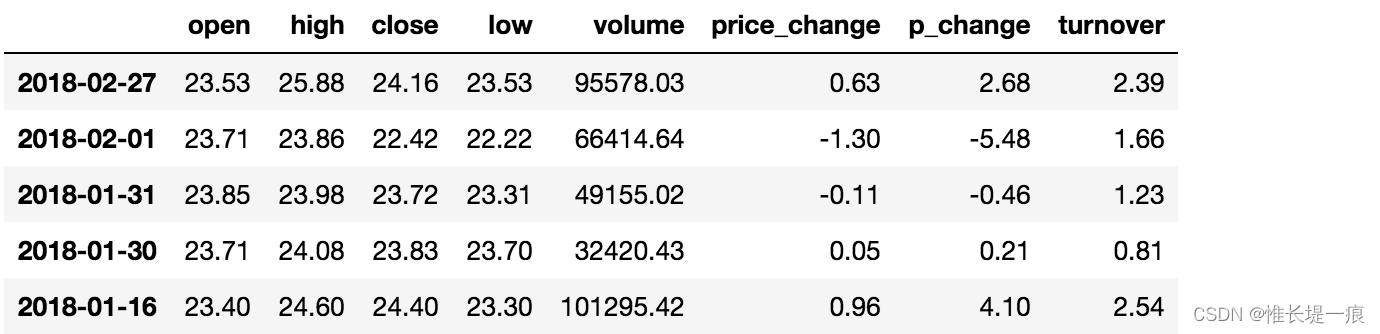
df = pd.read_csv('./data/stock_day.csv')# 打开一个csv文件
data = df['price_change'][0:20]# 选取price_change前二十行
data_index = data.sort_values(ascending=False)  #降序排列
data_index
6     0.82
1     0.69
11    0.65
0     0.63
2     0.54
4     0.44
3     0.36
5     0.28
12    0.20
17    0.11
8     0.09
15    0.05
14   -0.11
19   -0.20
9    -0.50
16   -0.73
18   -0.93
10   -0.97
13   -1.30
7    -1.50
Name: price_change, dtype: float64
- 使用series.sort_index(ascending=True)进行排序
data_index.sort_index(ascending=False)
运行结果:
19   -0.20
18   -0.93
17    0.11
16   -0.73
15    0.05
14   -0.11
13   -1.30
12    0.20
11    0.65
10   -0.97
9    -0.50
8     0.09
7    -1.50
6     0.82
5     0.28
4     0.44
3     0.36
2     0.54
1     0.69
0     0.63
Name: price_change, dtype: float64
2.2 DataFrame 排序
- 使用df.sort_values(by=, ascending=)
- 单个键或者多个键进行排序,
- 参数:
- by:指定排序参考的键
- ascending:默认升序
- ascending=False:降序
- ascending=True:升序
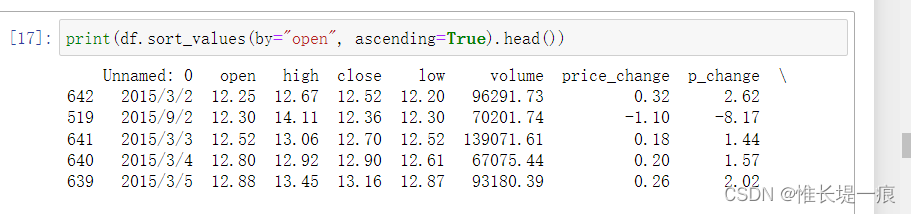
# 按照开盘价大小进行排序 , 使用ascending指定按照大小排序
print(df.sort_values(by="open", ascending=True).head())
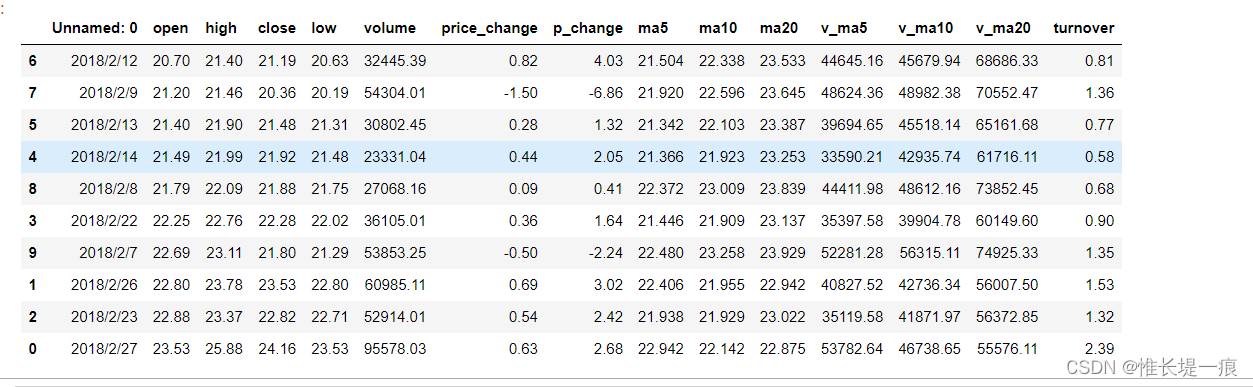
# 多列排序
# 先按照 open 列排序, 如果有相同的数据部分, 就按照 high 排序
data2 = df.head(10).sort_values(by=['open', 'high'])
data2
运行结果:
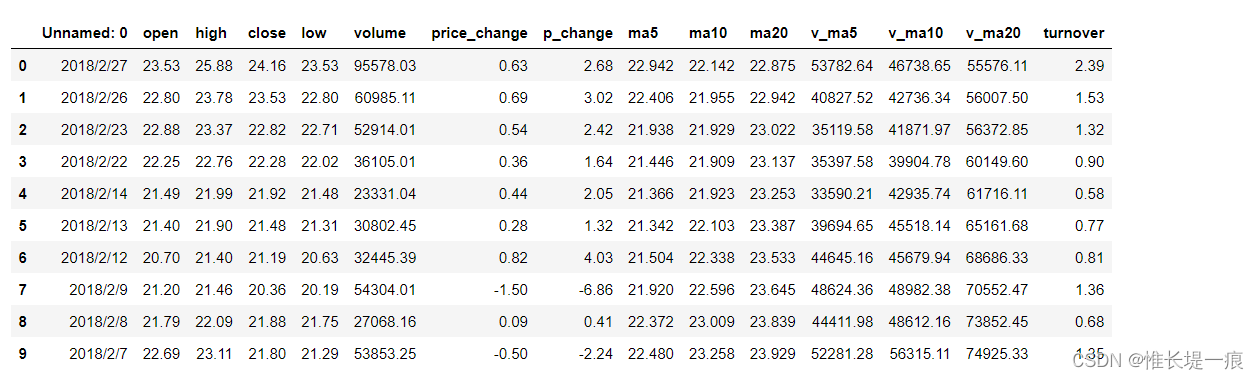
# DataFrame如果要按照索引排序, 只能按照行索引排序
data2.sort_index()
运行结果:
3. DataFrame运算
3.1 算数运算
比如进行数学运算加上具体的一个数字
-
add(other)
-
sub(other)
import pandas as pd

df = pd.read_csv('stock_day.csv')
print(df.open.add(1))


2018-02-27    24.53
2018-02-26    23.80
2018-02-23    23.88
2018-02-22    23.25
2018-02-14    22.49
3.2 逻辑运算
import pandas as pd

df = pd.read_csv('stock_day.csv')

print(df['open'] > 23)

2018-02-27     True
2018-02-26    False
2018-02-23    False
2018-02-22    False
2018-02-14    False
多个逻辑判断
print(df[(df["open"] > 23) & (df["open"] < 24)].head())
3.3 统计运算
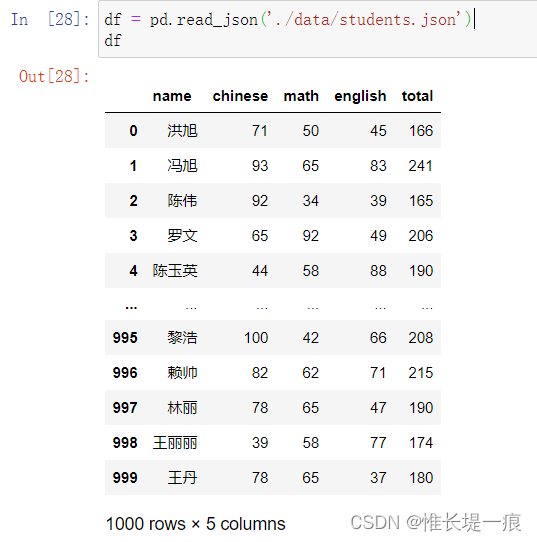
df = pd.read_json('./data/students.json')
df.describe()
df['math'].describe()
输出结果
count    1000.000000
mean       64.718000
std        20.404382
min        30.000000
25%        46.750000
50%        65.000000
75%        82.000000
max       100.000000
Name: math, dtype: float64
# count      行数
# mean       平均值
# std        标准差
# min        最小值
# 25%        四分位数
# 50%        中位数
# 75%        四分位数
# max        最大值
# axis 轴
# 运算的默认轴都是 axis=0 , 默认按照列统计
df[['chinese', 'math', 'english']].sum()
运行结果:
chinese    63752
math       64718
english    65817
dtype: int64
累计函数
cumsum | 计算前1/2/3/…/n个数的和 |
|---|---|
cummax | 计算前1/2/3/…/n个数的最大值 |
cummin | 计算前1/2/3/…/n个数的最小值 |
cumprod | 计算前1/2/3/…/n个数的积 |
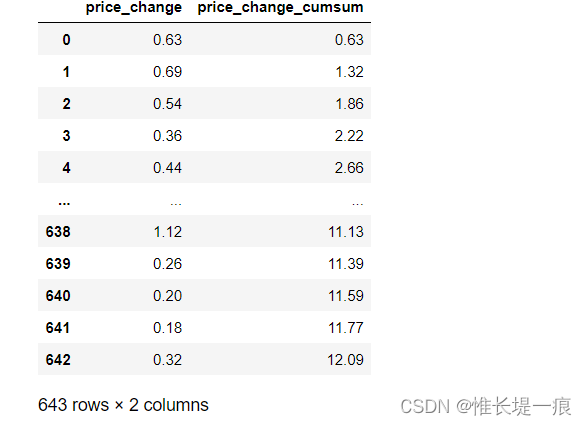
df = pd.read_csv('./data/stock_day.csv')
#cumsum函数是一种非常常用的统计分析函数,用它可以统计的数据的累计和。
#f(1)=x1,f(2)=x1+x2,
#f(n)=x1+x2+……xn
#新定义一个列
df['price_change_cumsum'] = df['price_change'].cumsum()

df[ ['price_change', 'price_change_cumsum']]
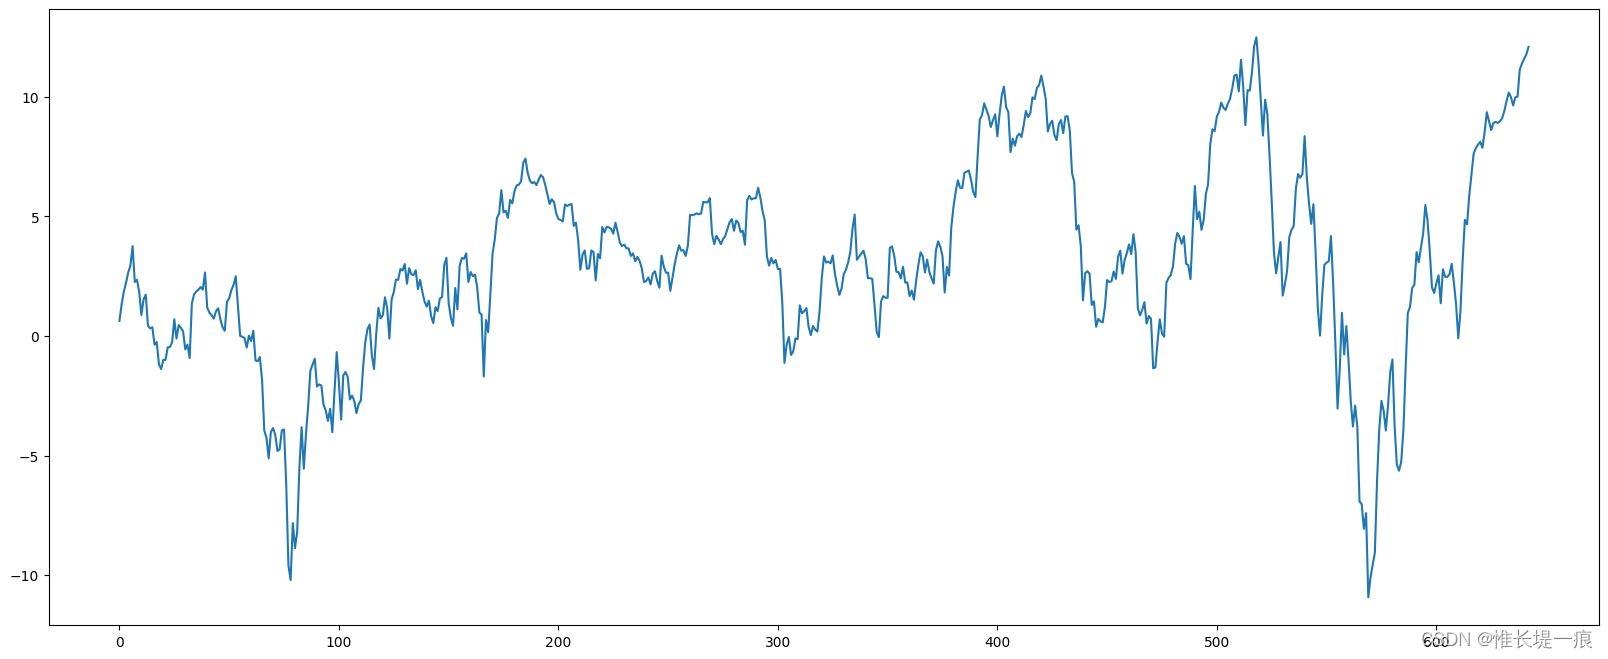
#在使用 matplotlib 绘图, 传递的是一个 Series, 会拿行索引作为X轴, 数据作为Y轴绘制
import matplotlib.pyplot as plt
plt.figure(figsize=(20, 8))
df['price_change_cumsum'].plot()


 174
174


 被折叠的 条评论
为什么被折叠?
被折叠的 条评论
为什么被折叠?
 到【灌水乐园】发言


