


series: [
{
type: 'bar',
barWidth: 12,
showBackground: true,
itemStyle: {
//圆角
barBorderRadius: [0, 20, 20, 0],
//渐变
color: new this.$echarts.graphic.LinearGradient(0, 0, 1, 0, [
{ offset: 0, color: '#dbe8fe' },
{ offset: 0.5, color: '#9dbffa' },
{ offset: 1, color: '#4185f4' }
])
},
}
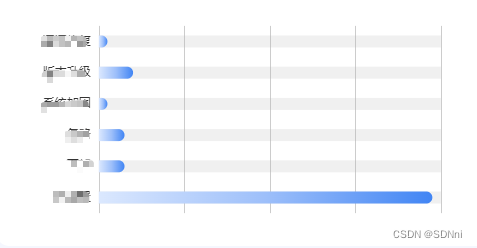
]之前参考其他文章是 color: new echarts.graphic.LinearGradient ,效果出不来,改成new $echarts.graphic.LinearGradient就可以了
贴一个效果图


 1万+
1万+

 被折叠的 条评论
为什么被折叠?
被折叠的 条评论
为什么被折叠?
 到【灌水乐园】发言


