


canvas
canvas绘制线段
<!DOCTYPE html>
<html lang="en">
<head>
    <meta charset="UTF-8">
    <meta http-equiv="X-UA-Compatible" content="IE=edge">
    <meta name="viewport" content="width=device-width, initial-scale=1.0">
    <title>Document</title>
</head>
<style>
    * {
        padding: 0;
        margin: 0;
    }
    canvas {
        border: 1px solid rgb(32, 30, 30);
    }
</style>
<body>
    <!-- canvas画布:双闭合标签 -->
    <!-- canvas默认标签宽度与高度 300 * 150 -->
    <!-- 在canvas中添加文字内容没有任何意义,只能通过js -->
    <!-- canvas的高度和宽度只能通过标签属性来设置 -->
    <!-- 不能通过样式设置宽度和高度 -->
    <canvas width="600" height="400"></canvas>
</body>
</html>
<script>
    // 通过js当中的笔去完成
    let canvas = document.querySelector('canvas');
    // 获取画布的笔(上下文)
    let ctx = canvas.getContext('2d');
    // 可以获取一些方法对象
    // console.log(ctx)
    // 绘制线段:绘制线段起点设置
    ctx.moveTo(100,100);
    // 其他点设置
    ctx.lineTo(100,200);
    ctx.lineTo(200,100);
    // 设置图形的填充的颜色,下面的fill是一起的
    ctx.fillStyle = 'red';
    ctx.fill();
    // 设置线段的颜色
    ctx.strokeStyle = 'pink';
    // 设置线段的宽度
    ctx.lineWidth = '20';
    // closePath方法表示起点和最终结束点的连接
    ctx.closePath();
    // stroke方法表示起点的其他点的连接
    ctx.stroke();
</script>
canvas绘制矩形
<!DOCTYPE html>
<html lang="en">
<head>
    <meta charset="UTF-8">
    <meta http-equiv="X-UA-Compatible" content="IE=edge">
    <meta name="viewport" content="width=device-width, initial-scale=1.0">
    <title>Document</title>
</head>
<style>
    * {
        padding: 0;
        margin: 0;
    }
    canvas {
        border: 1px solid rgb(32, 30, 30);
    }
</style>
<body>

    <canvas width="600" height="400"></canvas>
</body>
</html>
<script>
    // 获取节点
    let canvas = document.querySelector('canvas');
    // 获取上下文
    let ctx = canvas.getContext('2d');
    // 绘制矩形的第一种方法:参数为x,y,w,h;x:表示距离水平轴的距离,y表示距离上面顶部的距离,w表示100宽度,h表示高度200
    // 这种方法是不能设置填充颜色的
    ctx.strokeRect(100,200,100,200);
    // 第二种:填充矩形,参数和上面一样
    // 注意:必须要在绘制图形之前填充颜色
    ctx.fillStyle = 'skyblue';
    ctx.fill();
    ctx.fillRect(300,200,100,200);

</script>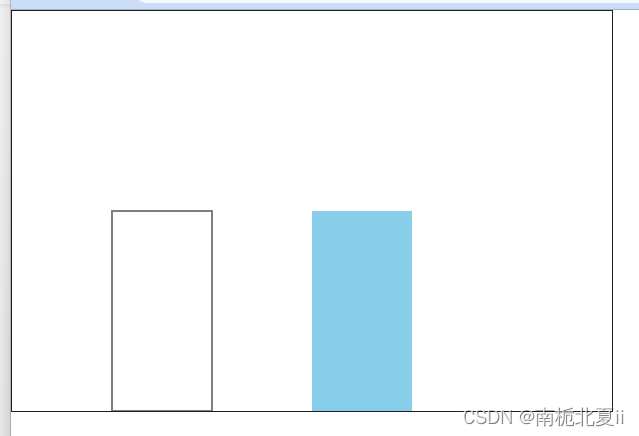
canvas绘制圆形
arc(x,y,redius,startAngle,endAngle,anticlockwise)
- x:圆心的x坐标
- y:圆心的y坐标
- redius:半径
- startAngle:开始角度
- endAngle:结束角度
- anticlockwise:是否逆时针(true)逆时针,false顺时针
<!DOCTYPE html>
<html lang="en">
<head>
    <meta charset="UTF-8">
    <meta http-equiv="X-UA-Compatible" content="IE=edge">
    <meta name="viewport" content="width=device-width, initial-scale=1.0">
    <title>Document</title>
</head>
<style>
    * {
        padding: 0;
        margin: 0;
    }
    canvas {
        border: 1px solid rgb(32, 30, 30);
    }
</style>
<body>

    <canvas width="600" height="400"></canvas>
</body>
</html>
<script>
    // 获取canvas
    let canvas = document.querySelector('canvas')
    // 获取上下文
    let ctx = canvas.getContext('2d')
    // 绘制圆形
    // 开始绘制
    ctx.beginPath();
    // 绘制圆形的方法:x,y,r,起始弧度,结束弧度,是否逆时针,360°=2.PI
    ctx.arc(100,100,50,0,2 * Math.PI,true);
    // 是指填充颜色
    ctx.fillStyle = 'red';
    ctx.fill()
    // 绘制圆
    ctx.stroke();


    // 绘制第二个圆
    // 注意:弧度有一个计算
    // 2 * PI * 弧度 = 360
    ctx.beginPath();
    ctx.arc(200,200,50,0,1,false);
    ctx.stroke();

</script>
清除画布和绘制文字
<!DOCTYPE html>
<html lang="en">
<head>
    <meta charset="UTF-8">
    <meta http-equiv="X-UA-Compatible" content="IE=edge">
    <meta name="viewport" content="width=device-width, initial-scale=1.0">
    <title>Document</title>
</head>
<style>
    * {
        padding: 0;
        margin: 0;
    }
    canvas {
        border: 1px solid rgb(32, 30, 30);
    }
</style>
<body>

    <canvas width="600" height="400"></canvas>
</body>
</html>
<script>
    // 获取节点
    let canvas = document.querySelector('canvas')
    // 获取上下文
    let ctx = canvas.getContext('2d')
    // 绘制矩形
    ctx.fillRect(100,200,100,200);
    // 清除画布
    // 清除全部画布
    // ctx.clearRect(0,0,600,400);
    // 清除部分画布
    // 表示x,y,宽度50,高度100
    ctx.clearRect(100,200,50,100);
    // 绘制文字
    // 设置文字大小
    ctx.font = "20px 微软雅黑";
    ctx.fillStyle = 'red';
    // 绘制文字
    // 参数表示:需要的文字,x,y坐标
    ctx.fillText("数据可视化",50,20)

</script>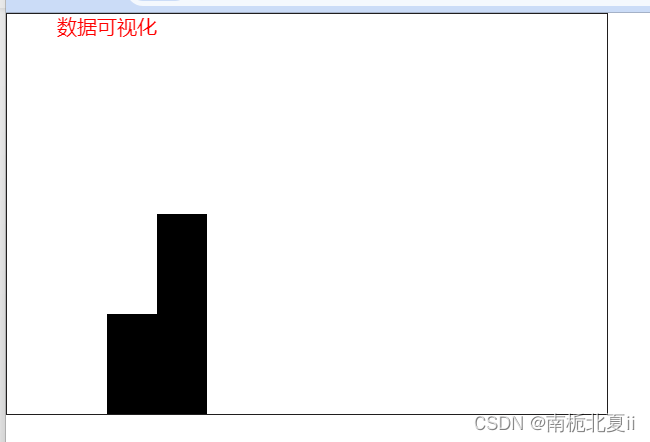
绘制柱状图
<!DOCTYPE html>
<html lang="en">
<head>
    <meta charset="UTF-8">
    <meta http-equiv="X-UA-Compatible" content="IE=edge">
    <meta name="viewport" content="width=device-width, initial-scale=1.0">
    <title>Document</title>
</head>
<style>
    * {
        padding: 0;
        margin: 0;
    }
    /* canvas {
        border: 1px solid rgb(201, 109, 109);
    } */
</style>
<body>

    <canvas width="800" height="420"></canvas>
</body>
</html>
<script>
    // 获取节点
    let canvas = document.querySelector('canvas');
    // 获取上下文
    let ctx = canvas.getContext('2d');
    // 绘制文字
    ctx.font = '16px 微软雅黑';
    ctx.fillText('数据可视化',50,80);
    // 绘制主线
    ctx.moveTo(100,100);
    ctx.lineTo(100,400);
    ctx.lineTo(700,400);
    // 连接点
    ctx.stroke();

    // 其他线
    ctx.moveTo(100,100);
    ctx.lineTo(700,100);
    ctx.fillText('150',70,110);
    ctx.moveTo(100,160);
    ctx.lineTo(700,160);
    ctx.fillText('120',70,170);
    ctx.moveTo(100,220);
    ctx.lineTo(700,220);
    ctx.fillText('90',70,230);
    ctx.moveTo(100,280);
    ctx.lineTo(700,280);
    ctx.fillText('60',70,290);
    ctx.moveTo(100,340);
    ctx.lineTo(700,340);
    ctx.fillText('30',70,350);
    ctx.fillText('0',80,400);
    ctx.stroke();

    // 绘制水平轴底部的线
    ctx.moveTo(250,400);
    ctx.lineTo(250,410);
    // 底部的文字
    ctx.fillText('食品',170,415);
    ctx.moveTo(400,400);
    ctx.lineTo(400,410);
    ctx.fillText('数码',310,415);
    ctx.moveTo(550,400);
    ctx.lineTo(550,410);
    ctx.fillText('服饰',460,415);
    ctx.fillText('箱包',600,415);
    ctx.stroke();

    // 绘制矩形
    ctx.fillStyle = 'red'
    ctx.fillRect(120,200,100,200)
</script>
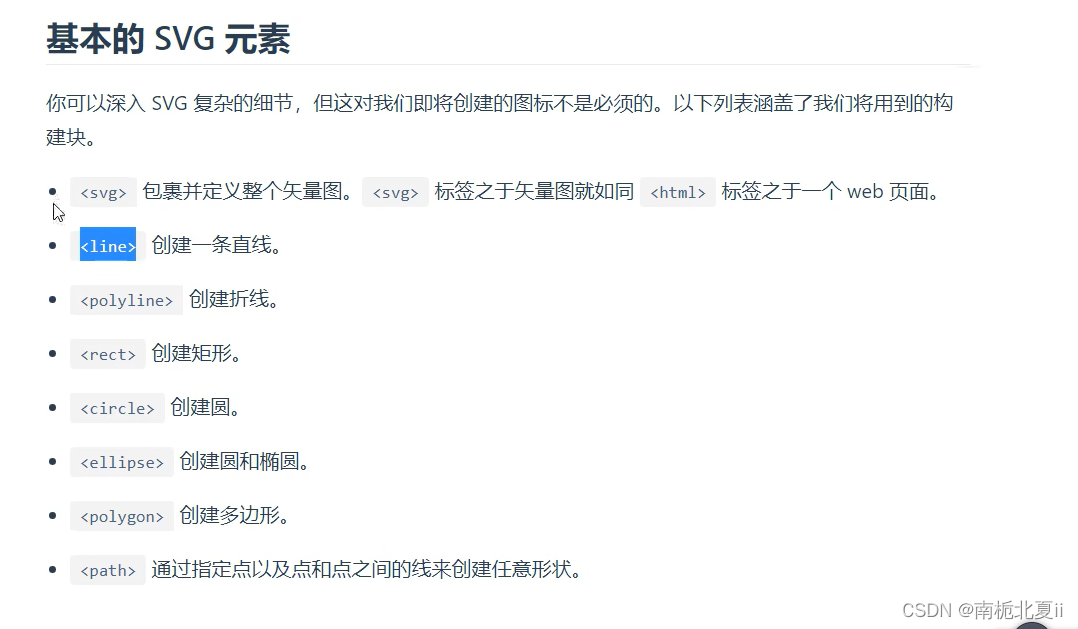
svg 基本使用
<!DOCTYPE html>
<html lang="en">
<head>
    <meta charset="UTF-8">
    <meta http-equiv="X-UA-Compatible" content="IE=edge">
    <meta name="viewport" content="width=device-width, initial-scale=1.0">
    <title>Document</title>
</head>
<style>
    * {
        margin: 0;
        padding: 0;
    }
    .box {
        width: 800px;
        height: 800px;
    }
</style>
<body>
    <!-- svg双闭合标签:默认宽度和高度300*150,svg绘制图形务必在svg标签内部绘制图形 -->
    <svg class="box">
        <!-- x1 y1第一个点的坐标,x2 y2第二个点的坐标,stroke表示绘制
        line标签用于绘制直线
        -->
        <line x1="100" y1="100" x2="200" y2="200" stroke="red"></line>
        <!-- 绘制折线 -->
        <!-- <polyline points="x1 y1 x2 y2 x3 y3"></polyline> -->
        <!-- 折线默认是填充黑色,fill-opacity去除填充,stroke表示折线颜色 -->
        <polyline points="300 300, 50 100, 120 400" fill-opacity="0" stroke="cyan"></polyline>
        <!-- 绘制矩形 -->
        <!-- fill属性:表示填充颜色 -->
        <rect x="400" y="400" width="150" height="50" fill="pink"></rect>
        <!-- 绘制圆型 -->
        <!-- cx,cy表示圆心,r半径,style表示样式 -->
        <circle cx="370" cy="95" r="50" style="stroke: black; fill:none" ></circle>

        <!-- 绘制椭圆 -->
        <!-- cx,cy表示圆心,rx表示x轴半径,ry表示y轴半径 -->
        <ellipse cx="500" cy="500" rx="100" ry="50" style="fill: black;"></ellipse>
        <!-- 绘制多边形 -->
        <!-- <polygon points="x1 y1, x2 y2, x3 y3"></polygon> -->
        <polygon points="600 100, 300 400, 750 100" stroke="red" fill-opacity="0"></polygon>

        <!-- 绘制任意图型 -->
        <!-- M:移动到初始位置 L:画线 Z:将结束和开始点闭合-->
        <!-- <path d="
        M x1 y1
        L x2 y2
        L x3 y3
        Z
        ">

        </path> -->
        <path d="
        M 10 10
        L 400 20
        L 30 120
        L 50 99
        Z
        ">

        </path>
    </svg>
</body>
</html>
ECharts
echarts基本使用
<!DOCTYPE html>
<html lang="en">
<head>
    <meta charset="UTF-8">
    <meta http-equiv="X-UA-Compatible" content="IE=edge">
    <meta name="viewport" content="width=device-width, initial-scale=1.0">
    <title>Document</title>
    <!-- 引入echarts依赖包 -->
    <script src="https://cdn.staticfile.net/echarts/4.7.0/echarts.min.js"></script>
</head>
<style>
    * {
        margin: 0;
        padding: 0;
    }
    div {
        width: 800px;
        height: 400px;
    }
</style>
<body>
    <!-- 准备一个容器用于显示图标 -->
    <div></div>
</body>
</html>
<script>
    // 基于准备好的dom初始化echarts实例
    let dom = document.querySelector('div');
    // 创建echarts实例
    let mycharts = echarts.init(dom);
    // console.log(mycharts);
    // 指定图表 的配置项与数据
    mycharts.setOption({
        // 图表的标题
        title:{
            // 主标题的设置
            text:'数据可视化',
            // 子标题
            subtext:'echarts基本使用',
            // 主标题的颜色
            textStyle:{
                color:'cyan'
            },
            // 设置标题的位置
            left:'center',
        },
        // x轴的配置项
        xAxis:{
            // 数据
            // data表示底部数据的设置
            data:['衣服','直播','游戏','电影']
        },
        // y轴的配置项
        yAxis:{
            // 显示y轴的线
            axisLine:{
                show:true
            },
            // 显示y轴的刻度
            axisTick:{
                show:true
            },
        },
        // 系列的设置:绘制什么样类型的图表,数据的展示都在这里
        series:[
            {
                // 图表类型的设置,bar表示柱状图,pie表示饼状图,line折线图
                type:'bar',
                data:[10,20,30,40],
                // 表示柱状图的颜色
                color:'blue',
            }
        ]

    })
</script>
多个容器显示多个表
<!DOCTYPE html>
<html lang="en">
<head>
    <meta charset="UTF-8">
    <meta http-equiv="X-UA-Compatible" content="IE=edge">
    <meta name="viewport" content="width=device-width, initial-scale=1.0">
    <title>Document</title>
    <!-- 引入echarts依赖包 -->
    <script src="https://cdn.staticfile.net/echarts/4.7.0/echarts.min.js"></script>
</head>
<style>
    * {
        margin: 0;
        padding: 0;
    }
    div {
        width: 800px;
        height: 400px;
    }
</style>
<body>
    <!--准备一个容器用于显示图标 -->
    <div class="box1"></div>
    <div class="box2"></div>
</body>
</html>
<script>
    // 基于准备好的dom初始化echarts实例
    let dom1 = document.querySelector('.box1');
    let dom2 = document.querySelector('.box2')
    // 创建echarts实例
    let mycharts1 = echarts.init(dom1);
    let mycharts2 = echarts.init(dom2);
    // console.log(mycharts);
    // 指定图表 的配置项与数据
    mycharts1.setOption({
        // 图表的标题
        title:{
            // 主标题的设置
            text:'数据可视化',
            // 子标题
            subtext:'echarts基本使用',
            // 主标题的颜色
            textStyle:{
                color:'cyan'
            },
            // 设置标题的位置
            left:'center',
        },
        // x轴的配置项
        xAxis:{
            // 数据
            // data表示底部数据的设置
            data:['衣服','直播','游戏','电影']
        },
        // y轴的配置项
        yAxis:{
            // 显示y轴的线
            axisLine:{
                show:true
            },
            // 显示y轴的刻度
            axisTick:{
                show:true
            },
        },
        // 系列的设置:绘制什么样类型的图表,数据的展示都在这里
        series:[
            {
                // 图表类型的设置,bar表示柱状图,pie表示饼状图,line折线图
                type:'bar',
                data:[10,20,30,40],
                // 表示柱状图的颜色
                color:'blue',
            }
        ]

    });
    // 第二个图表的配置项
    mycharts2.setOption({
        title:{
            // 主标题
            text:'折线图',
            left:'center',
            textStyle:{
                color:'red',
            },
            // 子标题
            subtext:'echarts基本使用',
            subtextStyle:{
                color:'skyblue',
            }
        },
        // x轴
        xAxis:{
            data:['星期一','星期二','星期三','星期四','星期五','星期六','星期日']
        },
        // y轴
        yAxis:{

        },
        // 图表类型与数据
        series:[
            {
                type:'line',
                data:[10,20,15,44,2,19,100],
            }
        ]
    })
</script>
一个容器显示多个图表
 series:[
            {
                // 图表类型的设置,bar表示柱状图,pie表示饼状图,line折线图
                type:'bar',
                data:[10,20,30,40],
                // 表示柱状图的颜色
                color:'blue',
            },
            {
                // 折线图
                type:'line',
                data:[10,20,30,40]
            },
            {
                // 饼图
                type:'pie',
                // name:名称,value:值,显示文字
                data:[{name:'x',value:10},{name:'y',value:20},{name:'z',value:30},{name:'t',value:40}],
                // 饼图的宽度和高度
                width:150,
                height:150,
                // 饼图的位置
                left:150,
                top:100,
                // 表示饼图的半径
                radius:25,
            }
        ]
数据集和dataset
<!DOCTYPE html>
<html lang="en">
<head>
    <meta charset="UTF-8">
    <meta http-equiv="X-UA-Compatible" content="IE=edge">
    <meta name="viewport" content="width=device-width, initial-scale=1.0">
    <title>Document</title>
    <!-- 引入echarts依赖包 -->
    <script src="https://cdn.staticfile.net/echarts/4.7.0/echarts.min.js"></script>
</head>
<style>
    * {
        margin: 0;
        padding: 0;
    }
    div {
        width: 800px;
        height: 400px;
    }
</style>
<body>
    <!--准备一个容器用于显示图标 -->
    <div class="box1"></div>

</body>
</html>
<script>
    // 基于准备好的dom初始化echarts实例
    let dom1 = document.querySelector('.box1');

    // 创建echarts实例
    let mycharts1 = echarts.init(dom1);
    // 数据集
    let data = [
        // 第一个是衣服,第二个是10表示柱状图数据,第二个表示折线图数据,第三个表示饼图名字是x的数据
        ["衣服",10,46,'x',30],
        ["直播",20,28,'y',40],
        ["游戏",30,39,'z',20],
        ["电影",5,10,'t',10],
    ]
    // console.log(mycharts);
    // 指定图表 的配置项与数据
    mycharts1.setOption({
        // 设置字符集
        dataset:{
            // 数据源
            source:data
        },
        // 图表的标题
        title:{
            // 主标题的设置
            text:'数据可视化',
            // 子标题
            subtext:'echarts基本使用',
            // 主标题的颜色
            textStyle:{
                color:'cyan'
            },
            // 设置标题的位置
            left:'center',
        },
        // x轴的配置项
        xAxis:{
            // 数据
            // data表示底部数据的设置
            data:['衣服','直播','游戏','电影']
        },
        // y轴的配置项
        yAxis:{
            // 显示y轴的线
            axisLine:{
                show:true
            },
            // 显示y轴的刻度
            axisTick:{
                show:true
            },
        },
        // 系列的设置:绘制什么样类型的图表,数据的展示都在这里
        series:[
            {
                // 图表类型的设置,bar表示柱状图,pie表示饼状图,line折线图
                type:'bar',
                // data:[10,20,30,40],
                // 表示柱状图的颜色
                color:'blue',
                encode:{
                    // encode表示可以定义data中的数据表示那个表,y表示data中柱状图的数据位置
                    y:1
                }
            },
            {
                // 折线图
                type:'line',
                // data:[10,20,30,40]
                encode:{
                    y:2
                }
            },
            {
                // 饼图
                type:'pie',
                // name:名称,value:值,显示文字
                // data:[{name:'x',value:10},{name:'y',value:20},{name:'z',value:30},{name:'t',value:40}],
                // 饼图的宽度和高度
                width:150,
                height:150,
                // 饼图的位置
                left:120,
                top:150,
                // 表示饼图的半径
                radius:25,
                encode:{
                    // 饼图旁边的文字
                    itemName:3,
                    value:4
                }
            }
        ]

    });
    // 第二个图表的配置项

</script>
内置组件
<!DOCTYPE html>
<html lang="en">
<head>
    <meta charset="UTF-8">
    <meta http-equiv="X-UA-Compatible" content="IE=edge">
    <meta name="viewport" content="width=device-width, initial-scale=1.0">
    <title>Document</title>
    <!-- 引包 -->
    <script src="https://cdn.staticfile.net/echarts/4.7.0/echarts.min.js"></script>
</head>
<style>
    * {
        margin: 0;
        padding: 0;
    }
    .box {
        width: 100%;
        height: 500px;
        /* border: 1px solid rgb(68, 60, 60); */
    }
</style>
<body>
    <div class="box"></div>
</body>
</html>
<script>
    // 获取容器
    let dom = document.querySelector('.box');
    // 初始化
    let mycharts = echarts.init(dom);
    // console.log(mycharts);
    // 配置数据
    mycharts.setOption({
        // 标题
        title:{
            text:'echarts组件'
        },
        xAxis:{
            data:['游戏','电影','直播','娱乐']
        },
        yAxis:{},
        series:[
            {
                name:'柱状图',
                type:'bar',
                data:[20,30,40,50]
            },
            {
                name:'折线图',
                type:'line',
                data:[30,40,50,60]
            }
        ],
        // 提示组件
        tooltip:{
            // 提示框文字的颜色
            textStyle:{
                color:'red'
            }
        },
        // 系列切换组件
        legend:{
            data:['柱状图','折线图']
        },
        // 工具栏组件
        toolbox:{
            show:true,
            feature:{
                saveAsImage:{},
                dataZoom:{
                    yAxisIndex:"none"
                },
                dataView:{
                    readOnly:false
                },
                magicType:{
                    type:['line','bar']
                },
                restore:{},
            }
        },
        // 缩放
        dataZoom:{},
        // 调整图表布局
        grid:{
            left:30
        }
    })
</script>

坐标体系
单个坐标
<!DOCTYPE html>
<html lang="en">
<head>
    <meta charset="UTF-8">
    <meta http-equiv="X-UA-Compatible" content="IE=edge">
    <meta name="viewport" content="width=device-width, initial-scale=1.0">
    <title>Document</title>
    <!-- 引包 -->
    <script src="https://cdn.staticfile.net/echarts/4.7.0/echarts.min.js"></script>
</head>
<style>
    * {
        margin: 0;
        padding: 0;
    }
    .box {
        width: 100%;
        height: 500px;
        /* border: 1px solid rgb(68, 60, 60); */
    }
</style>
<body>
    <div class="box"></div>
</body>
</html>
<script>
    // 获取容器
    let dom = document.querySelector('.box');
    // 初始化
    let mycharts = echarts.init(dom);
    // 一个坐标体系:散点图
    mycharts.setOption({
        // 标题
        title:{
            text:'一个坐标系'
        },
        // x轴
        xAxis:{
            // 可以是数据更加聚合
            type:'category'
        },
        // y轴
        yAxis:{},
        // 散点图
        series:[
            {
                type:'scatter',
                // 散点图数据
                data:[
                    [10,20],
                    [30,64],
                    [20,16],
                    [78,56],
                ]
            }
        ]
    })
</script>
双坐标体系
<!DOCTYPE html>
<html lang="en">
<head>
    <meta charset="UTF-8">
    <meta http-equiv="X-UA-Compatible" content="IE=edge">
    <meta name="viewport" content="width=device-width, initial-scale=1.0">
    <title>Document</title>
    <!-- 引包 -->
    <script src="https://cdn.staticfile.net/echarts/4.7.0/echarts.min.js"></script>
</head>
<style>
    * {
        margin: 0;
        padding: 0;
    }
    .box {
        width: 100%;
        height: 500px;
        /* border: 1px solid rgb(68, 60, 60); */
    }
</style>
<body>
    <div class="box"></div>
</body>
</html>
<script>
    // 获取容器
    let dom = document.querySelector('.box');
    // 初始化
    let mycharts = echarts.init(dom);
    // 双坐标
    mycharts.setOption({
        title:{
            text:'双坐标'
        },
        xAxis:{
            data:['游戏','直播','经济','娱乐']
        },
        yAxis:[
            {
                // 显示y轴的线
                axisLine:{
                    show:true
                },
                // 显示y轴的刻度
                axisTick:{
                    show:true
                }
            },
            {
                // 显示y轴的线
                axisLine:{
                    show:true
                },
                // 显示y轴的刻度
                axisTick:{
                    show:true
                }
            }
        ],
        series:[
            {
                type:'line',
                data:[10,20,30,40],
                // 表示折线图用的是第一个y轴,索引值为0的y轴
                yAxisIndex:0,
            },
            {
                type:'bar',
                data:[5,10,20,30],
                // 表示柱状图用的是第二个y轴
                yAxisIndex:1
            }
        ]
    })
</script>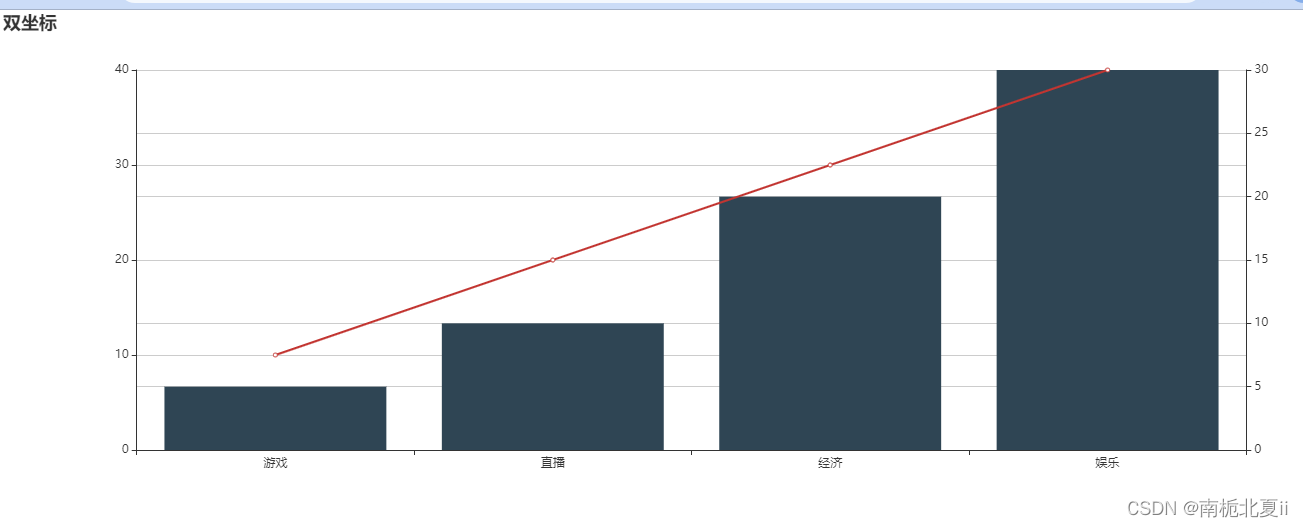


 1613
1613

 被折叠的 条评论
为什么被折叠?
被折叠的 条评论
为什么被折叠?
 到【灌水乐园】发言


