


目录
背景:
在我们前端开发的时候,想实现一个效果,当用户点击Dialog 对话框就可以弹出echarts图表。可当我们正常写代码时候会发现,Dialog 对话框并没有我们想要的效果,往往是空白一片,这是为什么呢?
在Element-ui官网中有这样一句话描述Dialog 对话框:
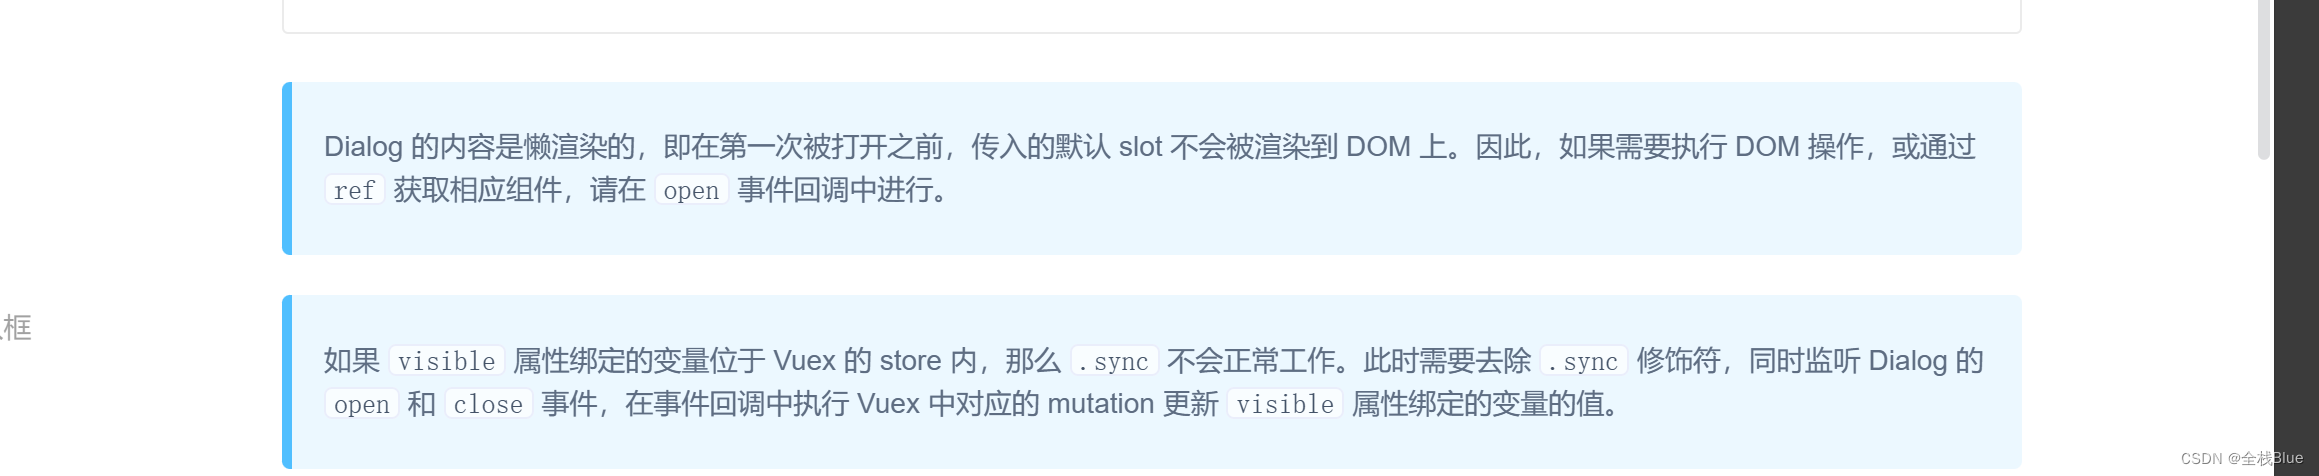
这句话就告诉我们这样一个道理:在vue底层,通过document.ElementById("id")获取DOM节点时,DOM节点还未生成,所以获取不到DOM节点,图表更不会显示 。
解决方案:
既然我们知道了问题,那如何去解决这样的问题呢?
使用element-ui中dialog提供的open(Dialog 打开的回调)方法,结合定时器vue的this.$nextTick(),原理就是等dom渲染完之后,再使用echarts。
其中:this.$nextTick()的作用是将回调延迟到下次 DOM 更新循环之后执行。在修改数据之后立即使用它,然后等待 DOM 更新。它跟全局方法 Vue.nextTick 一样,不同的是回调的 this 自动绑定到调用它的实例上。
我们直接上代码,这样观众老爷们,会理解的更加深透。
案例:
核心代码:
<script>


export default {
  data() {
    return {
      dialogVisible: false,
    }
  },
  methods: {
    handleClose(done) {
        this.$confirm('确认关闭?')
          .then(_ => {
            done();
          })
          .catch(_ => {});
    },
      // 弹框的触发事件
    showDialog() {
      var yearData = [
    {
      year: "2020", // 年份
      data: [
        // 两个数组是因为有两条线
        [240, 170, 101, 134, 190, 230, 210, 230, 120, 230, 210, 120],
        [130, 164, 191, 324, 290, 330, 310, 213, 180, 200, 180, 120],
        [210, 300, 70, 100, 110, 200, 230, 180, 160, 119, 120, 180],
        [200, 74, 191, 214, 290, 130, 310, 213, 120, 110, 180, 170],
        [57, 64, 91, 124, 90, 130, 110, 113, 110, 130, 100, 120],
        [340, 270, 331, 434, 290, 330, 210, 230, 120, 230, 210, 120],
        [330, 270, 121, 134, 157, 230, 210, 230, 220, 230, 118, 120],
        [112, 231, 213, 215, 261, 278, 127, 129, 139, 199, 200, 210],
        [134,131,113,115,161,178,227,229,239,199,210,200],
      ]
    }
      ];

	this.dialogVisible = true;//展示弹窗
      let diameter = this.$refs.cc//放置echarts图示的div的ref值
      const myChart = this.$echarts.init(diameter);
    let diameterOption = {
    color: ["#00f2f1", "#ed3f35","#ddd","#00ff00","#ffa500","#800080","#0000ff"],
    tooltip: {
      trigger: "axis"
    },
    legend: {
      // 如果series 对象有name 值,则 legend可以不用写data
      // 修改图例组件 文字颜色
      textStyle: {
        color: "#4c9bfd"
      },
      // 这个10% 必须加引号
      right: "10%"
    },
    grid: {
      top: "20%",
      left: "3%",
      right: "4%",
      bottom: "3%",
      show: true, // 显示边框
      borderColor: "#012f4a", // 边框颜色
      containLabel: true // 包含刻度文字在内
    },

    xAxis: {
      type: "category",
      boundaryGap: false,
      data: [
        "1月",
        "2月",
        "3月",
        "4月",
        "5月",
        "6月",
        "7月",
        "8月",
        "9月",
        "10月",
        "11月",
        "12月"
      ],
      axisTick: {
        show: false // 去除刻度线
      },
      axisLabel: {
        color: "#4c9bfd" // 文本颜色
      },
      axisLine: {
        show: false // 去除轴线
      }
    },
    yAxis: {
      type: "value",
      axisTick: {
        show: false // 去除刻度线
      },
      axisLabel: {
        color: "#4c9bfd" // 文本颜色
      },
      axisLine: {
        show: false // 去除轴线
      },
      splitLine: {
        lineStyle: {
          color: "#012f4a" // 分割线颜色
        }
      }
    },
    series: [
      {
        name: "f1",
        type: "line",
        // true 可以让我们的折线显示带有弧度
        smooth: true,
        data: yearData[0].data[0]
      },
      {
        name: "f2",
        type: "line",
        smooth: true,
        data: yearData[0].data[1]
      },{
        name: "f3",
        type: "line",
        smooth: true,
        data: yearData[0].data[2]
      },
      {
        name: "f3",
        type: "line",
        smooth: true,
        data: yearData[0].data[3]
      },{
        name: "f4",
        type: "line",
        smooth: true,
        data: yearData[0].data[4]
      },{
        name: "f5",
        type: "line",
        smooth: true,
        data: yearData[0].data[5]
      },{
        name: "f6",
        type: "line",
        smooth: true,
        data: yearData[0].data[6]
      },
      {
        name: "f7",
        type: "line",
        smooth: true,
        data: yearData[0].data[7]
      },{
        name: "f8",
        type: "line",
        smooth: true,
        data: yearData[0].data[8]
      }
    ]
      };
      myChart.setOption(diameterOption);
},
open(){
        this.$nextTick(() => {
        //  执行echarts方法
          this.showDialog()
        })
      }

  }
}
</script>
解释代码:
dialogVisible控制这个弹窗出现的。
handleClose(done) 。弹窗自己需要的函数,不管,这里不重要,和它没有关系
showDialog()。这个就很重要了。我们在这个函数里面去实例化对象然后配置信息。我们在这里使用this.dialogVisible = true;来展示弹窗,这样就不需要去用到v-if或者v-on这样的事情了,避免麻烦。
我们知道对话框中无法加载echarts的原因是vue底层,通过document.ElementById("id")获取DOM节点时,DOM节点还未生成,所以获取不到DOM节点。那么我们只需要在对话框生成时有了dom节点时,去获取节点,那么我们就需要一个函数了,它的作用就是弹框打开的时候能够渲染ercharts.
所以在按钮上面我们继续使用showDialog()函数,虽然获取不到dom元素,因为没有生成,但是showDialog()里面有this.dialogVisible = true;我可以让弹窗出现呗。然后出现的同时,由于<el-dialog>上面有一个open事件被监听它每打开一次就会执行open()函数,所以打开的时候,又会去调用showDialog()函数,这样dom已经生成了,我们能够渲染了。
完整代码:
<template>
  <el-container>
  <el-header> <button v-on:click="showDialog">点我</button></el-header>
  <el-main>
    <el-dialog
  title="一年票价趋势"
  :visible.sync="dialogVisible"
  width="70%"
  @open="open()"
  :before-close="handleClose">
  <div id="cc" ref="cc" style="width:500px;height:400px;padding-top:40px"></div>
  <span slot="footer" class="dialog-footer">
    <el-button @click="dialogVisible = false">取 消</el-button>
    <el-button type="primary" @click="dialogVisible = false">确 定</el-button>
  </span>
</el-dialog>
  </el-main>
</el-container>
</template>

<script>


export default {
  data() {
    return {
      dialogVisible: false,
    }
  },
  methods: {
    handleClose(done) {
        this.$confirm('确认关闭?')
          .then(_ => {
            done();
          })
          .catch(_ => {});
    },
      // 弹框的触发事件
    showDialog() {
      var yearData = [
    {
      year: "2020", // 年份
      data: [
        // 两个数组是因为有两条线
        [240, 170, 101, 134, 190, 230, 210, 230, 120, 230, 210, 120],
        [130, 164, 191, 324, 290, 330, 310, 213, 180, 200, 180, 120],
        [210, 300, 70, 100, 110, 200, 230, 180, 160, 119, 120, 180],
        [200, 74, 191, 214, 290, 130, 310, 213, 120, 110, 180, 170],
        [57, 64, 91, 124, 90, 130, 110, 113, 110, 130, 100, 120],
        [340, 270, 331, 434, 290, 330, 210, 230, 120, 230, 210, 120],
        [330, 270, 121, 134, 157, 230, 210, 230, 220, 230, 118, 120],
        [112, 231, 213, 215, 261, 278, 127, 129, 139, 199, 200, 210],
        [134,131,113,115,161,178,227,229,239,199,210,200],
      ]
    }
      ];

	this.dialogVisible = true;//展示弹窗
      let diameter = this.$refs.cc//放置echarts图示的div的ref值
      const myChart = this.$echarts.init(diameter);
    let diameterOption = {
    color: ["#00f2f1", "#ed3f35","#ddd","#00ff00","#ffa500","#800080","#0000ff"],
    tooltip: {
      trigger: "axis"
    },
    legend: {
      // 如果series 对象有name 值,则 legend可以不用写data
      // 修改图例组件 文字颜色
      textStyle: {
        color: "#4c9bfd"
      },
      // 这个10% 必须加引号
      right: "10%"
    },
    grid: {
      top: "20%",
      left: "3%",
      right: "4%",
      bottom: "3%",
      show: true, // 显示边框
      borderColor: "#012f4a", // 边框颜色
      containLabel: true // 包含刻度文字在内
    },

    xAxis: {
      type: "category",
      boundaryGap: false,
      data: [
        "1月",
        "2月",
        "3月",
        "4月",
        "5月",
        "6月",
        "7月",
        "8月",
        "9月",
        "10月",
        "11月",
        "12月"
      ],
      axisTick: {
        show: false // 去除刻度线
      },
      axisLabel: {
        color: "#4c9bfd" // 文本颜色
      },
      axisLine: {
        show: false // 去除轴线
      }
    },
    yAxis: {
      type: "value",
      axisTick: {
        show: false // 去除刻度线
      },
      axisLabel: {
        color: "#4c9bfd" // 文本颜色
      },
      axisLine: {
        show: false // 去除轴线
      },
      splitLine: {
        lineStyle: {
          color: "#012f4a" // 分割线颜色
        }
      }
    },
    series: [
      {
        name: "f1",
        type: "line",
        // true 可以让我们的折线显示带有弧度
        smooth: true,
        data: yearData[0].data[0]
      },
      {
        name: "f2",
        type: "line",
        smooth: true,
        data: yearData[0].data[1]
      },{
        name: "f3",
        type: "line",
        smooth: true,
        data: yearData[0].data[2]
      },
      {
        name: "f3",
        type: "line",
        smooth: true,
        data: yearData[0].data[3]
      },{
        name: "f4",
        type: "line",
        smooth: true,
        data: yearData[0].data[4]
      },{
        name: "f5",
        type: "line",
        smooth: true,
        data: yearData[0].data[5]
      },{
        name: "f6",
        type: "line",
        smooth: true,
        data: yearData[0].data[6]
      },
      {
        name: "f7",
        type: "line",
        smooth: true,
        data: yearData[0].data[7]
      },{
        name: "f8",
        type: "line",
        smooth: true,
        data: yearData[0].data[8]
      }
    ]
      };
      myChart.setOption(diameterOption);
},open(){
        this.$nextTick(() => {
        //  执行echarts方法
          this.showDialog()
        })
      }

  }
}
</script>
感谢观众老爷的观看,下一篇文章我将讲解如何使用three.js与vue中的Dialog 对话框结合。


 1095
1095

 被折叠的 条评论
为什么被折叠?
被折叠的 条评论
为什么被折叠?
 到【灌水乐园】发言


