


1 准备工作
1.1 定义数据
string[] X = new String[]{"A1","B1","C1","D1","E1","F1","G1","H1","A2","B2","C2","D2","E2","F2","G2","H2"};
double[] Y = new double[]{15,17,26,33,78,45,88,95,123,58,97,29,75,84,96,88};
1.2 图面要素

1.3 数据与控件绑定
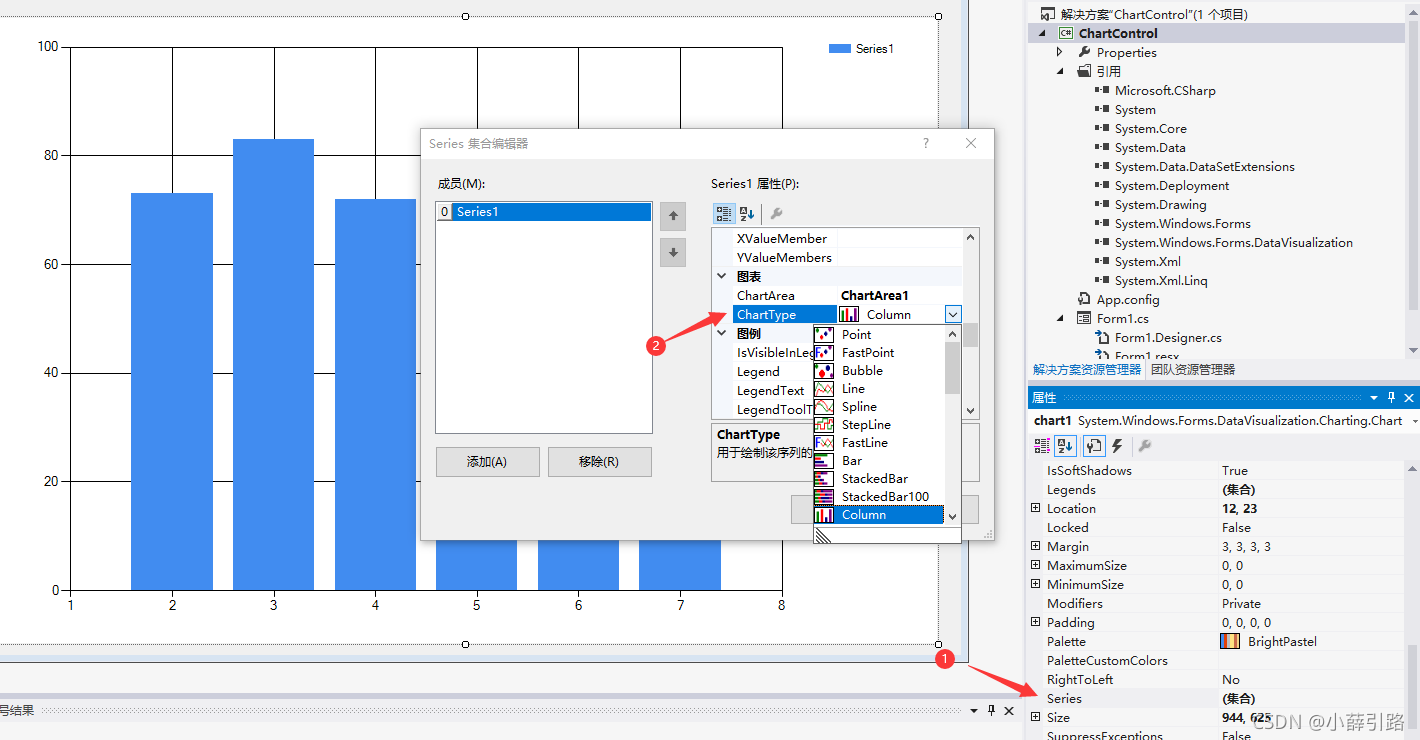
this.chart1.Series[0].Points.DataBindXY(X, Y);1.4 设置图表的类型
1.5 输出图表为图片
this.chart1.SaveImage("导出结果.jpg", System.Drawing.Imaging.ImageFormat.Jpeg);2 绘制饼图
2.1 坐标标签倾斜显示
ChartAreas(集合)->Axes(集合)->左边成员选X axis->右侧 标签->label style->angle,输入角度
ChartArea -- Axes -- LabelStyle -- Angle
代码如下:
chartArea1.AxisX.LabelStyle.Angle = 45;2.2 显示所有X标签
图标的属性栏->ChartAreas(集合)->Axes(集合)->左边成员选X axis->右侧 间隔interval改为1
2.3 标签分层显示
ChartAreas(集合)->Axes(集合)->左边成员选X axis->右侧 标签->label style->isstaggered设置为true即可;该值设置为True时,旋转角度只能是0,90,-90
2.4 绘制饼状图引出线
Series -- CustomProperties -- PieLineColor
只有Pie才有引出线的属性
series1.CustomProperties = "PieLineColor=255\\, 128\\, 128";2.5 饼图的文字显示在外边
Series -- CustomProperties -- PieLabelStyle -- Outside
2.6 设置标签文本

效果图:

2.7 避免压盖标签


 1万+
1万+

 被折叠的 条评论
为什么被折叠?
被折叠的 条评论
为什么被折叠?
 到【灌水乐园】发言


