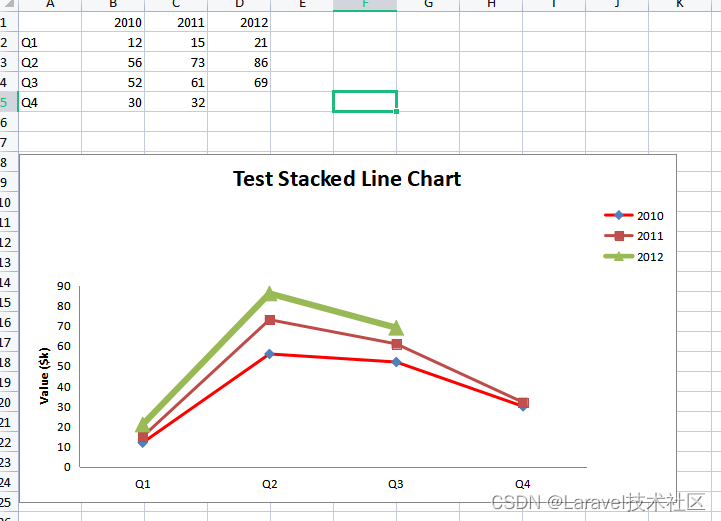
利用phpspreadsheet导出Excel图表(折线图、饼状图、柱状图)

安装 phpoffice/phpspreadsheet

composer require phpoffice/phpspreadsheet

折线图

需要使用的包

use PhpOffice\PhpSpreadsheet\Chart\Chart;
use PhpOffice\PhpSpreadsheet\Chart\DataSeries;
use PhpOffice\PhpSpreadsheet\Chart\DataSeriesValues;
use PhpOffice\PhpSpreadsheet\Chart\Layout;
use PhpOffice\PhpSpreadsheet\Chart\Legend as ChartLegend;
use PhpOffice\PhpSpreadsheet\Chart\PlotArea;
use PhpOffice\PhpSpreadsheet\Chart\Properties;
use PhpOffice\PhpSpreadsheet\Chart\Title;
use PhpOffice\PhpSpreadsheet\IOFactory;
use PhpOffice\PhpSpreadsheet\Spreadsheet;

实例代码

$spreadsheet = new Spreadsheet();
  $worksheet = $spreadsheet->getActiveSheet();
  $worksheet->fromArray(
      [
          ['', 2010, 2011, 2012],
          ['Q1', 12, 15, 21],
          ['Q2', 56, 73, 86],
          ['Q3', 52, 61, 69],
          ['Q4', 30, 32, 0],
      ]
  );

  $dataSeriesLabels = [
      new DataSeriesValues(DataSeriesValues::DATASERIES_TYPE_STRING, 'Worksheet!$B$1', null, 1), // 2010
      new DataSeriesValues(DataSeriesValues::DATASERIES_TYPE_STRING, 'Worksheet!$C$1', null, 1), // 2011
      new DataSeriesValues(DataSeriesValues::DATASERIES_TYPE_STRING, 'Worksheet!$D$1', null, 1), // 2012
  ];
  $dataSeriesLabels[0]->setFillColor('FF0000');
  $xAxisTickValues = [
      new DataSeriesValues(DataSeriesValues::DATASERIES_TYPE_STRING, 'Worksheet!$A$2:$A$5', null, 4), // Q1 to Q4
  ];

  $dataSeriesValues = [
      new DataSeriesValues(DataSeriesValues::DATASERIES_TYPE_NUMBER, 'Worksheet!$B$2:$B$5', null, 4),
      new DataSeriesValues(DataSeriesValues::DATASERIES_TYPE_NUMBER, 'Worksheet!$C$2:$C$5', null, 4),
      new DataSeriesValues(DataSeriesValues::DATASERIES_TYPE_NUMBER, 'Worksheet!$D$2:$D$5', null, 4),
  ];
  $dataSeriesValues[2]->setLineWidth(60000 / Properties::POINTS_WIDTH_MULTIPLIER);
  // Build the dataseries
  $series = new DataSeries(
      DataSeries::TYPE_LINECHART, // plotType
      DataSeries::GROUPING_STANDARD, // plotGrouping
      range(0, count($dataSeriesValues) - 1), // plotOrder
      $dataSeriesLabels, // plotLabel
      $xAxisTickValues, // plotCategory
      $dataSeriesValues, // plotValues
      null,
      true
  );

  $series->setPlotDirection(DataSeries::DIRECTION_COL);

  // 把值标注在上面
//            $layout1 = new Layout();
//            $layout1->setShowVal(true);
//            $layout1->setShowPercent(true);
//            $plotArea = new PlotArea($layout1, [$series]);
  // Set the series in the plot area
  $plotArea = new PlotArea(null, [$series]);
  // Set the chart legend
  $legend = new ChartLegend(ChartLegend::POSITION_TOPRIGHT, null, false);

  $title = new Title('Test Stacked Line Chart');
  $yAxisLabel = new Title('Value ($k)');

  // Create the chart
  $chart = new Chart(
      'chart1', // name
      $title, // title
      $legend, // legend
      $plotArea, // plotArea
      true, // plotVisibleOnly
      DataSeries::EMPTY_AS_GAP, // displayBlanksAs
      null, // xAxisLabel
      $yAxisLabel  // yAxisLabel
  );

  // Set the position where the chart should appear in the worksheet
  $chart->setTopLeftPosition('A7');
  $chart->setBottomRightPosition('o30');

  // Add the chart to the worksheet
  $worksheet->addChart($chart);

  // Save Excel 2007 file
  $filename = "test";
  header('Content-Type: application/vnd.openxmlformats-officedocument.spreadsheetml.sheet;charset=UTF-8');
  header('Content-Disposition: attachment;filename="' . $filename . '.xlsx"');
  header('Cache-Control: max-age=0');
  ob_end_clean();
  $writer = IOFactory::createWriter($spreadsheet, 'Xlsx');
  $writer->setIncludeCharts(true);
  $writer->save("php://output");
  $spreadsheet->disconnectWorksheets();

效果图实例图

饼状图

需要使用的包

use PhpOffice\PhpSpreadsheet\Chart\Chart;
use PhpOffice\PhpSpreadsheet\Chart\DataSeries;
use PhpOffice\PhpSpreadsheet\Chart\DataSeriesValues;
use PhpOffice\PhpSpreadsheet\Chart\Layout;
use PhpOffice\PhpSpreadsheet\Chart\PlotArea;
use PhpOffice\PhpSpreadsheet\Chart\Title;
use PhpOffice\PhpSpreadsheet\IOFactory;
use PhpOffice\PhpSpreadsheet\Spreadsheet;
use PhpOffice\PhpSpreadsheet\Chart\Legend as ChartLegend;

实例代码

$spreadsheet = new Spreadsheet();
        $worksheet = $spreadsheet->getActiveSheet();
        $worksheet->fromArray(
            [
                ['', 2010, 2011, 2012],
                ['Q1', 12, 15, 21],
                ['Q2', 56, 73, 86],
                ['Q3', 52, 61, 69],
                ['Q4', 30, 32, 0],
            ]
        );
        $dataSeriesLabels1 = [
            new DataSeriesValues(DataSeriesValues::DATASERIES_TYPE_STRING, 'Worksheet!$C$1', null, 1), // 2011
        ];
        $xAxisTickValues1 = [
            new DataSeriesValues(DataSeriesValues::DATASERIES_TYPE_STRING, 'Worksheet!$A$2:$A$5', null, 4), // Q1 to Q4
        ];
        $dataSeriesValues1 = [
            new DataSeriesValues(DataSeriesValues::DATASERIES_TYPE_NUMBER, 'Worksheet!$C$2:$C$5', null, 4),
        ];
        
        $series1 = new DataSeries(
            DataSeries::TYPE_PIECHART, // plotType
            null, // plotGrouping (Pie charts don't have any grouping)
            range(0, count($dataSeriesValues1) - 1), // plotOrder
            $dataSeriesLabels1, // plotLabel
            $xAxisTickValues1, // plotCategory
            $dataSeriesValues1          // plotValues
        );
        
        $layout1 = new Layout();
        $layout1->setShowVal(true);
        $layout1->setShowPercent(true);
        
        $plotArea1 = new PlotArea($layout1, [$series1]);
        $legend1 = new ChartLegend(ChartLegend::POSITION_RIGHT, null, false);

        $title1 = new Title('Test Pie Chart');
        
        $chart1 = new Chart(
            'chart1', // name
            $title1, // title
            $legend1, // legend
            $plotArea1, // plotArea
            true, // plotVisibleOnly
            DataSeries::EMPTY_AS_GAP, // displayBlanksAs
            null, // xAxisLabel
            null   // yAxisLabel - Pie charts don't have a Y-Axis
        );/**/
        
        $chart1->setTopLeftPosition('A7');
        $chart1->setBottomRightPosition('H20');
        
        $worksheet->addChart($chart1);
        $dataSeriesLabels2 = [
            new DataSeriesValues(DataSeriesValues::DATASERIES_TYPE_STRING, 'Worksheet!$C$1', null, 1), // 2011
        ];

        $xAxisTickValues2 = [
            new DataSeriesValues(DataSeriesValues::DATASERIES_TYPE_STRING, 'Worksheet!$A$2:$A$5', null, 4), // Q1 to Q4
        ];
        $dataSeriesValues2 = [
            new DataSeriesValues(DataSeriesValues::DATASERIES_TYPE_NUMBER, 'Worksheet!$C$2:$C$5', null, 4),
        ];
        
        $series2 = new DataSeries(
            DataSeries::TYPE_DONUTCHART, // plotType
            null, // plotGrouping (Donut charts don't have any grouping)
            range(0, count($dataSeriesValues2) - 1), // plotOrder
            $dataSeriesLabels2, // plotLabel
            $xAxisTickValues2, // plotCategory
            $dataSeriesValues2        // plotValues
        );
        
        $layout2 = new Layout();
        $layout2->setShowVal(true);
        $layout2->setShowCatName(true);
        
        $plotArea2 = new PlotArea($layout2, [$series2]);

        $title2 = new Title('Test Donut Chart');
        
        $chart2 = new Chart(
            'chart2', // name
            $title2, // title
            null, // legend
            $plotArea2, // plotArea
            true, // plotVisibleOnly
            DataSeries::EMPTY_AS_GAP, // displayBlanksAs
            null, // xAxisLabel
            null   // yAxisLabel - Like Pie charts, Donut charts don't have a Y-Axis
        );
        
        $chart2->setTopLeftPosition('I7');
        $chart2->setBottomRightPosition('P20');
        
        $worksheet->addChart($chart2);
        
        $filename = "test";
        header('Content-Type: application/vnd.openxmlformats-officedocument.spreadsheetml.sheet;charset=UTF-8');
        header('Content-Disposition: attachment;filename="' . $filename . '.xlsx"');
        header('Cache-Control: max-age=0');
        ob_end_clean();
        $writer = IOFactory::createWriter($spreadsheet, 'Xlsx');
        $writer->setIncludeCharts(true);
        $writer->save("php://output");
        $spreadsheet->disconnectWorksheets();

效果图

在这里插入图片描述

柱状图

需要使用的包

use PhpOffice\PhpSpreadsheet\Chart\Chart;
use PhpOffice\PhpSpreadsheet\Chart\ChartColor;
use PhpOffice\PhpSpreadsheet\Chart\DataSeries;
use PhpOffice\PhpSpreadsheet\Chart\DataSeriesValues;
use PhpOffice\PhpSpreadsheet\Chart\GridLines;
use PhpOffice\PhpSpreadsheet\Chart\Layout;
use PhpOffice\PhpSpreadsheet\Chart\Legend as ChartLegend;
use PhpOffice\PhpSpreadsheet\Chart\PlotArea;
use PhpOffice\PhpSpreadsheet\Chart\Properties;
use PhpOffice\PhpSpreadsheet\Chart\Title;
use PhpOffice\PhpSpreadsheet\IOFactory;
use PhpOffice\PhpSpreadsheet\Spreadsheet;

实例代码

$spreadsheet = new Spreadsheet();
        $worksheet = $spreadsheet->getActiveSheet();
        $worksheet->fromArray(
            [
                ['', 2010, 2011, 2012],
                ['Q1', 12, 15, 21],
                ['Q2', 56, 73, 86],
                ['Q3', 52, 61, 69],
                ['Q4', 30, 32, 0],
            ]
        );

        $colors = [
            'cccccc', '00abb8', 'b8292f', 'eb8500',
        ];

        $dataSeriesLabels1 = [
            new DataSeriesValues(DataSeriesValues::DATASERIES_TYPE_STRING, 'Worksheet!$C$1', null, 1), // 2011
        ];
        $xAxisTickValues1 = [
            new DataSeriesValues(DataSeriesValues::DATASERIES_TYPE_STRING, 'Worksheet!$A$2:$A$5', null, 4), // Q1 to Q4
        ];
        $dataSeriesValues1 = [
            new DataSeriesValues(DataSeriesValues::DATASERIES_TYPE_NUMBER, 'Worksheet!$C$2:$C$5', null, 4, [], null, $colors),
        ];
        $labelLayout = new Layout();
        $labelLayout
            ->setShowVal(true)
            ->setLabelFontColor(new ChartColor('FFFF00'))
            ->setLabelFillColor(new ChartColor('accent2', null, 'schemeClr'));
        $dataSeriesValues1[0]->setLabelLayout($labelLayout);

        $series1 = new DataSeries(
            DataSeries::TYPE_BARCHART, // plotType
            null, // plotGrouping (Pie charts don't have any grouping)
            range(0, count($dataSeriesValues1) - 1), // plotOrder
            $dataSeriesLabels1, // plotLabel
            $xAxisTickValues1, // plotCategory
            $dataSeriesValues1          // plotValues
        );

        $layout1 = new Layout();
        $layout1->setShowVal(true);
        $layout1->setShowPercent(true);

        $plotArea1 = new PlotArea($layout1, [$series1]);
        $legend1 = new ChartLegend(ChartLegend::POSITION_RIGHT, null, false);
        $title1 = new Title('Test Bar Chart');
        $chart1 = new Chart(
            'chart1', // name
            $title1, // title
            $legend1, // legend
            $plotArea1, // plotArea
            true, // plotVisibleOnly
            DataSeries::EMPTY_AS_GAP, // displayBlanksAs
            null, // xAxisLabel
            null   // yAxisLabel - Pie charts don't have a Y-Axis
        );
        $majorGridlinesY = new GridLines();
        $majorGridlinesY->setLineColorProperties('FF0000');
        $minorGridlinesY = new GridLines();
        $minorGridlinesY->setLineStyleProperty('dash', Properties::LINE_STYLE_DASH_ROUND_DOT);
        $chart1
            ->getChartAxisY()
            ->setMajorGridlines($majorGridlinesY)
            ->setMinorGridlines($minorGridlinesY);
        $majorGridlinesX = new GridLines();
        $majorGridlinesX->setLineColorProperties('FF00FF');
        $minorGridlinesX = new GridLines();
        $minorGridlinesX->activateObject();
        $chart1
            ->getChartAxisX()
            ->setMajorGridlines($majorGridlinesX)
            ->setMinorGridlines($minorGridlinesX);

        $chart1->setTopLeftPosition('A7');
        $chart1->setBottomRightPosition('H20');

        $worksheet->addChart($chart1);

        $dataSeriesLabels2 = [
            new DataSeriesValues(DataSeriesValues::DATASERIES_TYPE_STRING, 'Worksheet!$C$1', null, 1), // 2011
        ];
        $xAxisTickValues2 = [
            new DataSeriesValues(DataSeriesValues::DATASERIES_TYPE_STRING, 'Worksheet!$A$2:$A$5', null, 4), // Q1 to Q4
        ];
        $dataSeriesValues2 = [
            $dataSeriesValues2Element = new DataSeriesValues(DataSeriesValues::DATASERIES_TYPE_NUMBER, 'Worksheet!$C$2:$C$5', null, 4),
        ];
        $dataSeriesValues2Element->setFillColor($colors);

        $series2 = new DataSeries(
            DataSeries::TYPE_DONUTCHART, // plotType
            null, // plotGrouping (Donut charts don't have any grouping)
            range(0, count($dataSeriesValues2) - 1), // plotOrder
            $dataSeriesLabels2, // plotLabel
            $xAxisTickValues2, // plotCategory
            $dataSeriesValues2        // plotValues
        );

        $layout2 = new Layout();
        $layout2->setShowVal(true);
        $layout2->setShowCatName(true);
        $layout2->setLabelFillColor(new ChartColor('FFFF00'));

        $plotArea2 = new PlotArea($layout2, [$series2]);

        $title2 = new Title('Test Donut Chart');

        $chart2 = new Chart(
            'chart2', // name
            $title2, // title
            null, // legend
            $plotArea2, // plotArea
            true, // plotVisibleOnly
            DataSeries::EMPTY_AS_GAP, // displayBlanksAs
            null, // xAxisLabel
            null   // yAxisLabel - Like Pie charts, Donut charts don't have a Y-Axis
        );

        $chart2->setTopLeftPosition('I7');
        $chart2->setBottomRightPosition('P20');

        $worksheet->addChart($chart2);

        $filename = "test";
        header('Content-Type: application/vnd.openxmlformats-officedocument.spreadsheetml.sheet;charset=UTF-8');
        header('Content-Disposition: attachment;filename="' . $filename . '.xlsx"');
        header('Cache-Control: max-age=0');
        ob_end_clean();
        $writer = IOFactory::createWriter($spreadsheet, 'Xlsx');
        $writer->setIncludeCharts(true);
        $writer->save("php://output");
        $spreadsheet->disconnectWorksheets();

效果图

在这里插入图片描述

  • 0
    点赞
  • 0
    收藏
    觉得还不错? 一键收藏
  • 打赏
    打赏
  • 0
    评论

“相关推荐”对你有帮助么?

  • 非常没帮助
  • 没帮助
  • 一般
  • 有帮助
  • 非常有帮助
提交
评论
添加红包

请填写红包祝福语或标题

红包个数最小为10个

红包金额最低5元

当前余额3.43前往充值 >
需支付:10.00
成就一亿技术人!
领取后你会自动成为博主和红包主的粉丝 规则
hope_wisdom
发出的红包

打赏作者

Laravel技术社区

你的鼓励将是我创作的最大动力

¥1 ¥2 ¥4 ¥6 ¥10 ¥20
扫码支付:¥1
获取中
扫码支付

您的余额不足,请更换扫码支付或充值

打赏作者

实付
使用余额支付
点击重新获取
扫码支付
钱包余额 0

抵扣说明:

1.余额是钱包充值的虚拟货币,按照1:1的比例进行支付金额的抵扣。
2.余额无法直接购买下载,可以购买VIP、付费专栏及课程。

余额充值