


1.在项目中使用如下命令通过npm安装echarts
npm install echarts --save2.在项目中使用echarts
import * as echarts from 'echarts';
3.为echarts图提供容器
<div class="hello">
<div id="container"/>
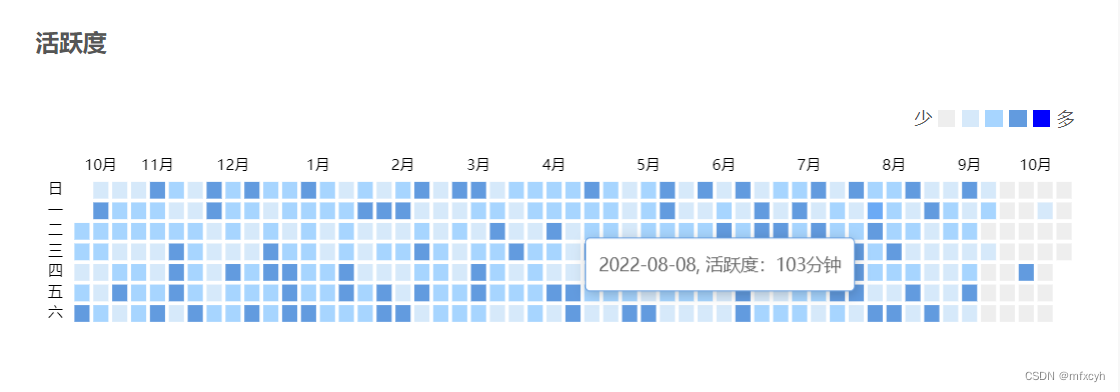
</div>4.在该图中,我们需要后端传回的数据类型为
const activeList = [
    ["2022-09-02",300],
    ["2022-05-01",250],
    ["2022-06-01",100],
    ["2022-10-03",60]
]
5.在项目中,我们使用activeList来接收后端传回的数据,但是当后端传回数据的长度为0时,echarts图会渲染失败,因此,我们获取当前日期,设置当前日期活跃度为0,确保activeList的长度不为0
if (hotPhoneList.length === 0){
    let date = new Date()
    let nowMonth = date.getMonth() + 1
    let strDate = date.getDate()
    let seperator = '-'
    if (nowMonth >= 1 && nowMonth <= 9){
        nowMonth = '0' + nowMonth
    }
    if (strDate >= 1 && strDate <= 9 ){
        strDate = '0' + strDate
    }
    let nowDate = date.getFullYear() + seperator + nowMonth + seperator + strDate
    console.log(nowDate)
    hotPhoneList = [
        [nowDate,0]
    ]
}
//activeList接收后端传回的数据,hotPhoneList是后端传回的数据
const activeList = hotPhoneList
6.完整代码
onMounted(()=>{
    // 得到前360天的每个日期
    function getBeforeDate(n) {
    var date = new Date();
    var year, month, day;
    date.setDate(date.getDate() - n);
    year = date.getFullYear();
    month = date.getMonth() + 1;
    day = date.getDate();
    return year + '-' + (month < 10 ? ('0' + month) : month) + '-' + (day < 10 ? ('0' + day) : day);
    }

    function getDatList() {
      let dayList = [];
      if (hotPhoneList.length === 0){
        let date = new Date()
        let nowMonth = date.getMonth() + 1
        let strDate = date.getDate()
        let seperator = '-'
        if (nowMonth >= 1 && nowMonth <= 9){
          nowMonth = '0' + nowMonth
        }
        if (strDate >= 1 && strDate <= 9 ){
          strDate = '0' + strDate
        }
        let nowDate = date.getFullYear() + seperator + nowMonth + seperator + strDate
        console.log(nowDate)
        hotPhoneList = [
          [nowDate,0]
        ]
      }
      const activeList = hotPhoneList
      // [
      //   ["2022-09-02",300],
      //   ["2022-05-01",250],
      //   ["2022-06-01",100],
      //   ["2022-10-03",60]
      // ]
      let i = 365;
      while (i >= 0) {
        dayList.push([getBeforeDate(i)])
        i--
      }
      for (let dayListElement of dayList) {
        for (let activeListElement of activeList) {
          if (dayListElement[0] === activeListElement[0]){
            dayListElement.splice(1)
            dayListElement.push(activeListElement[1])
          }else if (dayListElement.length === 1) {
            dayListElement.push(0)
          }
        }
      }
      return dayList
    }

    const chartDom = document.getElementById('container');
    //{locale:'ZH'}:使用echarts的中文编码
    const myChart = echarts.init(chartDom,null,{locale:'ZH'});
    let option;
    option = {
      //鼠标移入图时,通过hover效果显示每一天的日期和活跃度
      tooltip: {
        formatter(params) {
          return `${params.data[0]},`+`\n`+`
            活跃度:${params.data[1]}分钟`;
        },
      },
      visualMap: {
        //是否显示图上面的示例
        show: false,
        min: 0,
        max: 400,
        type: 'piecewise',
        orient: 'horizontal',
        left: 'center',
        top: 10,
        pieces: [      // 自定义每一段的范围,以及每一段的文字
          { gte: 150, color: 'blue' }, // 不指定 max,表示 max 为无限大(Infinity)。
          { gte: 100, lte: 150,  color: 'rgb(98,155,223)' },
          { gte: 50, lte: 100, color: 'rgb(167,213,255)' },
          { gte: 1, lte: 50, color: 'rgb(214,233,250)' },
          { lte: 0, color: 'rgb(238,238,238)'}],
      },
      calendar: {
        top: 40,
        left: 30,
        right: 30,
        width:800,
        height:115,
        cellSize: 25,
        splitLine: false,
        range: [getBeforeDate(365), getBeforeDate(0)],
        itemStyle: {
          borderWidth: 0.5,
          borderColor: 'black',
          normal:{
            borderWidth: 3,
            borderColor: 'rgb(255, 255, 255)'
          }
        },
        yearLabel: {show: false}
      },
      series: {
        type: 'heatmap',
        coordinateSystem: 'calendar',
        data: getDatList()
      }
    };
    option && myChart.setOption(option);
    })


 946
946

 被折叠的 条评论
为什么被折叠?
被折叠的 条评论
为什么被折叠?
 到【灌水乐园】发言


