


网上找了些文章,发现挺少的,下面一些文章有些帮助
https://cloud.tencent.com/developer/article/1800906
https://github.com/apache/dubbo/issues/6625
其中第二篇文有写到,通过dubbo的spi获取DataStore,然后再拿到dubbo的线程池,这个方法在dubbo2.7.5版本之后已经行不通了
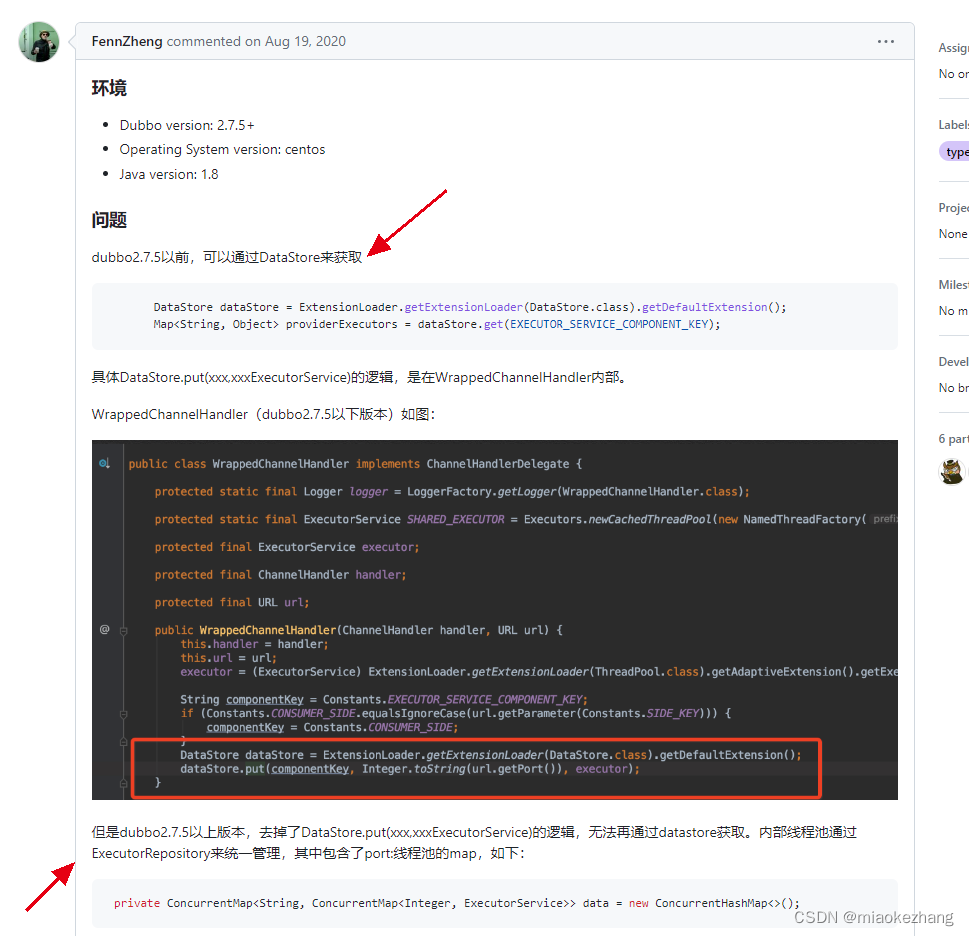
然后第二篇文章后面的一个回复里有一段代码,是可以拿到的
ExecutorRepository executorRepository = ExtensionLoader.getExtensionLoader(ExecutorRepository.class).getDefaultExtension();

if (executorRepository instanceof DefaultExecutorRepository) {
    DefaultExecutorRepository defaultExecutorRepository = (DefaultExecutorRepository) executorRepository;

    // data的key是固定的,要么是 EXECUTOR_SERVICE_COMPONENT_KEY 要么是 CONSUMER_SIDE
	// 反射读取data字段
    ConcurrentMap<String, ConcurrentMap<Integer, ExecutorService>> data = (ConcurrentMap<String, ConcurrentMap<Integer, ExecutorService>>) ReflectUtil.read(defaultExecutorRepository, "data");

    //provider
    ConcurrentMap<Integer, ExecutorService> executors = data.get(CommonConstants.EXECUTOR_SERVICE_COMPONENT_KEY);

    ......
也就是通过ExecutorRepository的默认扩展类去获取到dubbo线程池。
然后第一篇文章里,为了获取dubbo线程池,通过一个死循环去不断的去获取,然后注册到MeterReigstry里,这么做的原因,是因为不知道dubbo线程池实例化好的时机,比如代码如果这样写的话:
@Slf4j
@Component
public class DubboThreadPoolMetrics {

    @Autowired
    private MeterRegistry meterRegistry;

    @PostConstruct
    public void init() {
        try {
            ExecutorRepository executorRepository = ExtensionLoader.getExtensionLoader(ExecutorRepository.class).getDefaultExtension();
            if (executorRepository instanceof DefaultExecutorRepository) {
                DefaultExecutorRepository defaultExecutorRepository = (DefaultExecutorRepository) executorRepository;

                Field dataFiled = defaultExecutorRepository.getClass().getDeclaredField("data");
                dataFiled.setAccessible(true);
                ConcurrentMap<String, ConcurrentMap<Integer, ExecutorService>> executorMap = (ConcurrentMap<String, ConcurrentMap<Integer, ExecutorService>>) dataFiled.get(executorRepository);
                ConcurrentMap<Integer, ExecutorService> executors = executorMap.get(CommonConstants.EXECUTOR_SERVICE_COMPONENT_KEY);

                executors.forEach((port, executor) -> {

                    Tags tags = Tags.of("thread.pool.name", "dubboThreadPool", "port", Integer.toString(port));

                    if (executor instanceof ThreadPoolExecutor) {
                        // 也可以通过microMeter自带的JVM线程池绑定器ExecutorServiceMetrics去绑定dubbo的线程池
                        ThreadPoolExecutor tp = (ThreadPoolExecutor) executor;
                        // prometheus会将指标转为自己的命名风格:dubbo_thread_pool_core_size
                        Gauge.builder("dubbo.thread.pool.core.size", tp, ThreadPoolExecutor::getCorePoolSize)
                                .description("核心线程数")
                                //.baseUnit("threads")
                                .tags(tags)
                                .register(meterRegistry);
                        Gauge.builder("dubbo.thread.pool.largest.size", tp, ThreadPoolExecutor::getLargestPoolSize)
                                .description("历史最高线程数")
                                //.baseUnit("threads")
                                .tags(tags)
                                .register(meterRegistry);
                        Gauge.builder("dubbo.thread.pool.max.size", tp, ThreadPoolExecutor::getMaximumPoolSize)
                                .description("最大线程数")
                                //.baseUnit("threads")
                                .tags(tags)
                                .register(meterRegistry);
                        Gauge.builder("dubbo.thread.pool.active.size", tp, ThreadPoolExecutor::getActiveCount)
                                .description("活跃线程数")
                                //.baseUnit("threads")
                                .tags(tags)
                                .register(meterRegistry);
                        Gauge.builder("dubbo.thread.pool.thread.count", tp, ThreadPoolExecutor::getPoolSize)
                                .description("当前线程数")
                                //.baseUnit("threads")
                                .tags(tags)
                                .register(meterRegistry);
                        Gauge.builder("dubbo.thread.pool.queue.size", tp, e -> e.getQueue().size())
                                .description("队列大小")
                                //.baseUnit("threads")
                                .tags(tags)
                                .register(meterRegistry);
                        Gauge.builder("dubbo.thread.pool.taskCount", tp, ThreadPoolExecutor::getTaskCount)
                                .description("任务总量")
                                //.baseUnit("threads")
                                .tags(tags)
                                .register(meterRegistry);
                        Gauge.builder("dubbo.thread.pool.completedTaskCount", tp, ThreadPoolExecutor::getCompletedTaskCount)
                                .description("已完成的任务量")
                                //.baseUnit("threads")
                                .tags(tags)
                                .register(meterRegistry);
                    }
                });
            }
        } catch (Exception e) {
            log.error("e:", e);
        }
    }
}
在一个bean的@PostContruct里面去获取dubbo线程池,发现是获取不到的:
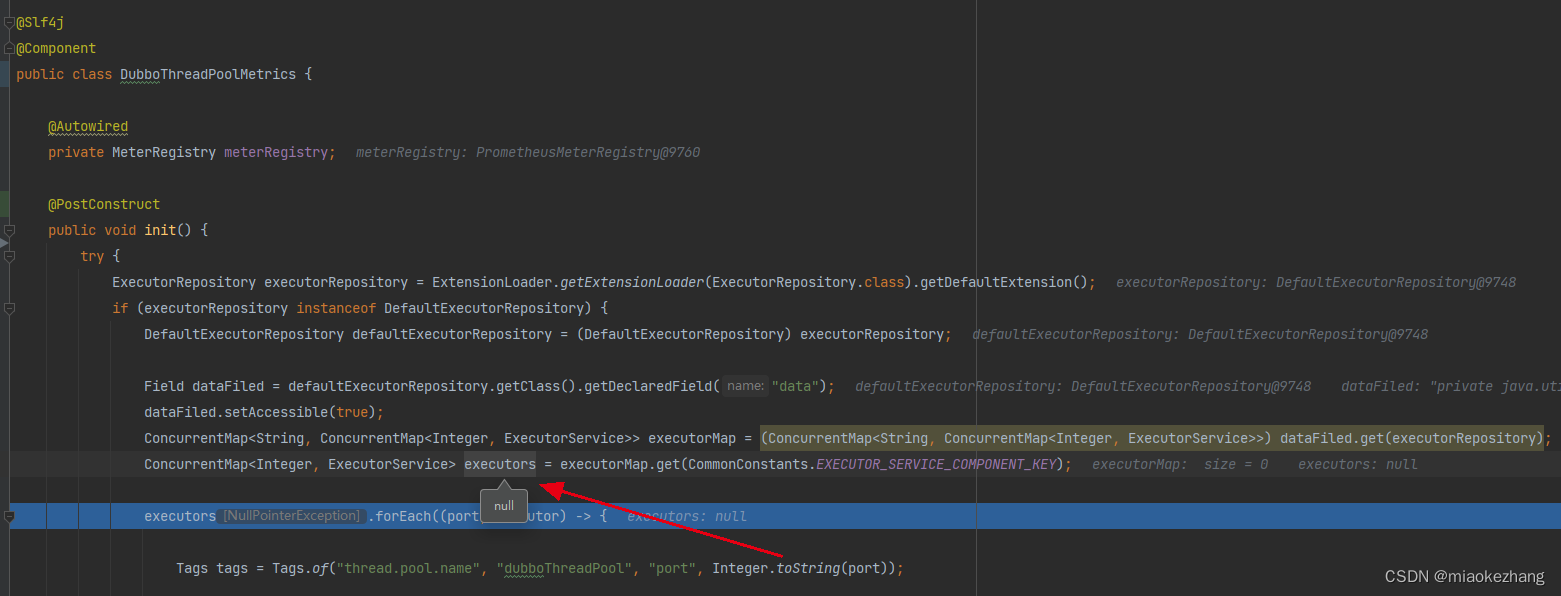
原因就是我们这个DubboThreadPoolMetrics在执行到@PostContruct的init方法的时候,dubbo的线程池还没来得及初始化呢。
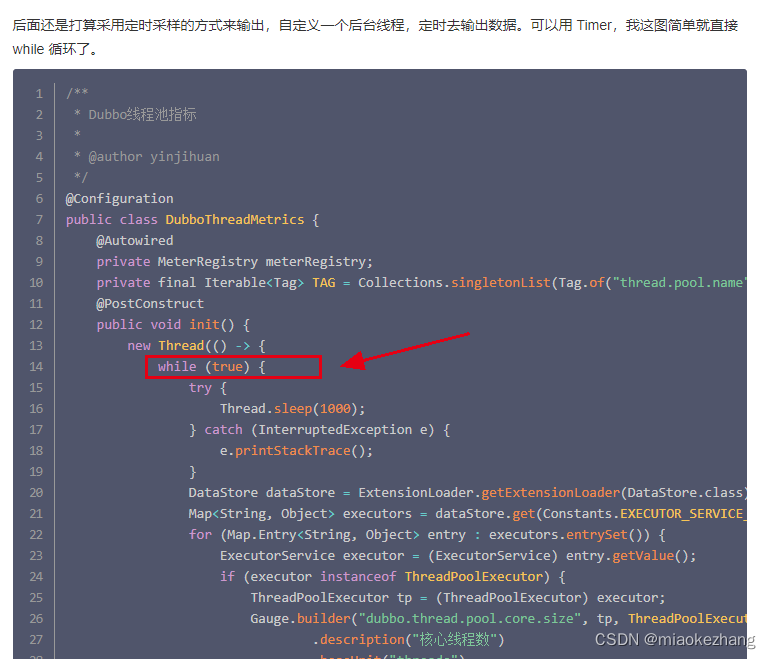
然后第一篇文章里,通过一个死循环去不断的获取dubbo线程池,在后面的某个时间点肯定是能拿到的,但是每次都要去获取,然后还要每次还要注册到MeterReigstry上,很明显有点浪费资源了。
有没有什么办法,可以让我们知道dubbo的线程池初始化好的时机呢?这样可以拿到了后只要注册到MeterReigstry一次就好了~
通过看dubbo源码(我的版本是2.7.15)可以发现,dubbo的service在export后,有去发布一个事件
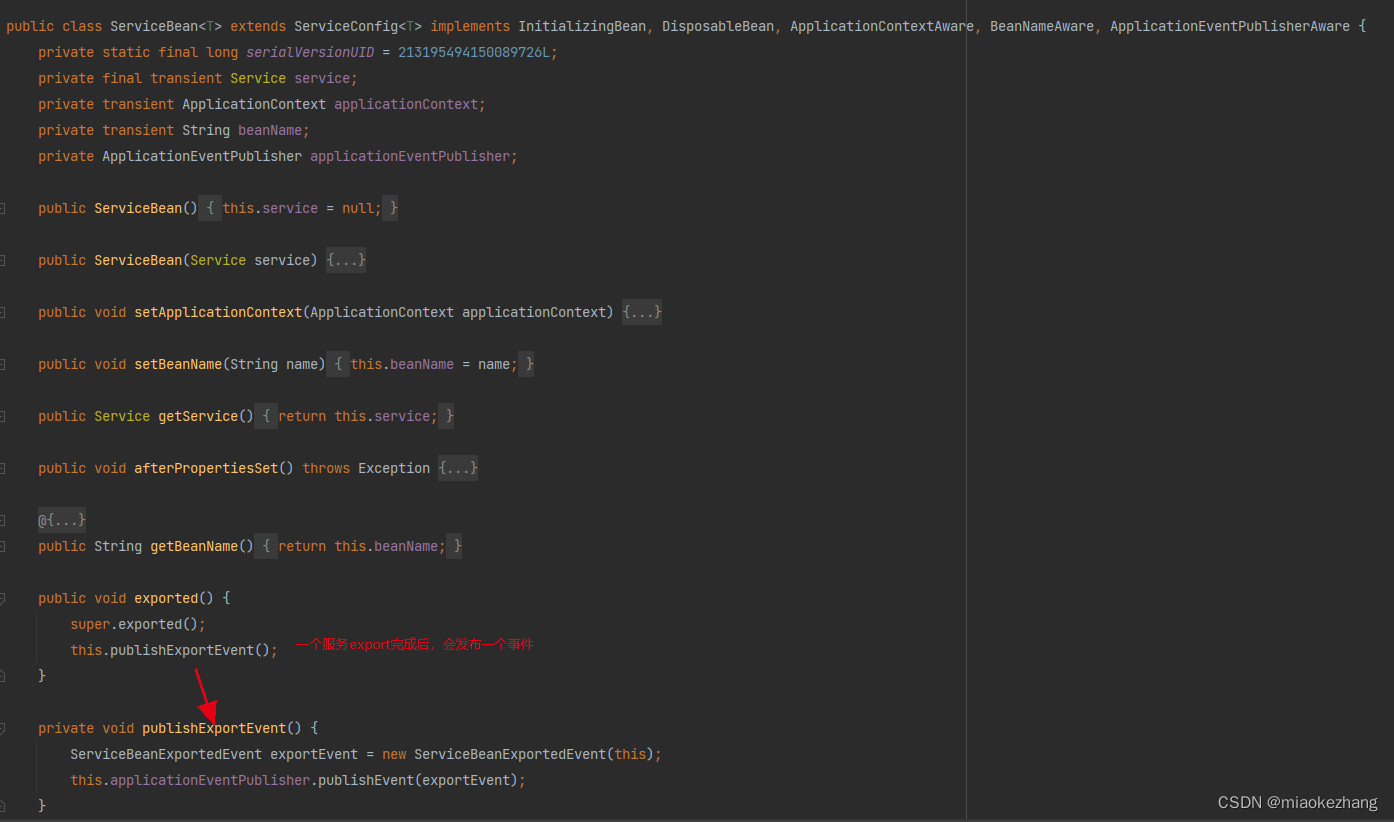
而dubbo的一个服务export的动作大致上包括去注册到zk,然后开启一个netty进程作为server,大概也能猜到在启动netty阶段,dubbo的线程池也就实例化好了,所以只要监听截图里发布的ServiceBeanExportedEvent事件,也就可以能确定dubbo线程池肯定初始化好了。
import io.micrometer.core.instrument.Gauge;
import io.micrometer.core.instrument.MeterRegistry;
import io.micrometer.core.instrument.Tags;
import lombok.extern.slf4j.Slf4j;
import org.apache.dubbo.common.constants.CommonConstants;
import org.apache.dubbo.common.extension.ExtensionLoader;
import org.apache.dubbo.common.threadpool.manager.DefaultExecutorRepository;
import org.apache.dubbo.common.threadpool.manager.ExecutorRepository;
import org.apache.dubbo.config.spring.context.event.ServiceBeanExportedEvent;
import org.springframework.beans.factory.annotation.Autowired;
import org.springframework.context.ApplicationListener;
import org.springframework.stereotype.Component;

import java.lang.reflect.Field;
import java.util.concurrent.ConcurrentMap;
import java.util.concurrent.ExecutorService;
import java.util.concurrent.ThreadPoolExecutor;
import java.util.concurrent.atomic.AtomicBoolean;

@Slf4j
@Component
public class DubboThreadPoolMetrics implements ApplicationListener<ServiceBeanExportedEvent> {

    private final AtomicBoolean inited = new AtomicBoolean(false);

    @Autowired
    private MeterRegistry meterRegistry;

    public void init() {
        // 多个dubbo service在export后,都会进来,但其实只需要进来一次就可以了
        if (!inited.compareAndSet(false, true)) {
            return;
        }
        try {
            ExecutorRepository executorRepository = ExtensionLoader.getExtensionLoader(ExecutorRepository.class).getDefaultExtension();
            if (executorRepository instanceof DefaultExecutorRepository) {
                DefaultExecutorRepository defaultExecutorRepository = (DefaultExecutorRepository) executorRepository;

                Field dataFiled = defaultExecutorRepository.getClass().getDeclaredField("data");
                dataFiled.setAccessible(true);
                ConcurrentMap<String, ConcurrentMap<Integer, ExecutorService>> executorMap = (ConcurrentMap<String, ConcurrentMap<Integer, ExecutorService>>) dataFiled.get(executorRepository);
                ConcurrentMap<Integer, ExecutorService> executors = executorMap.get(CommonConstants.EXECUTOR_SERVICE_COMPONENT_KEY);

                executors.forEach((port, executor) -> {

                    Tags tags = Tags.of("thread.pool.name", "dubboThreadPool", "port", Integer.toString(port));

                    if (executor instanceof ThreadPoolExecutor) {
                        // 也可以通过microMeter自带的JVM线程池绑定器ExecutorServiceMetrics去绑定dubbo的线程池
                        ThreadPoolExecutor tp = (ThreadPoolExecutor) executor;
                        // prometheus会将指标转为自己的命名风格:dubbo_thread_pool_core_size
                        Gauge.builder("dubbo.thread.pool.core.size", tp, ThreadPoolExecutor::getCorePoolSize)
                                .description("核心线程数")
                                //.baseUnit("threads")
                                .tags(tags)
                                .register(meterRegistry);
                        Gauge.builder("dubbo.thread.pool.largest.size", tp, ThreadPoolExecutor::getLargestPoolSize)
                                .description("历史最高线程数")
                                //.baseUnit("threads")
                                .tags(tags)
                                .register(meterRegistry);
                        Gauge.builder("dubbo.thread.pool.max.size", tp, ThreadPoolExecutor::getMaximumPoolSize)
                                .description("最大线程数")
                                //.baseUnit("threads")
                                .tags(tags)
                                .register(meterRegistry);
                        Gauge.builder("dubbo.thread.pool.active.size", tp, ThreadPoolExecutor::getActiveCount)
                                .description("活跃线程数")
                                //.baseUnit("threads")
                                .tags(tags)
                                .register(meterRegistry);
                        Gauge.builder("dubbo.thread.pool.thread.count", tp, ThreadPoolExecutor::getPoolSize)
                                .description("当前线程数")
                                //.baseUnit("threads")
                                .tags(tags)
                                .register(meterRegistry);
                        Gauge.builder("dubbo.thread.pool.queue.size", tp, e -> e.getQueue().size())
                                .description("队列大小")
                                //.baseUnit("threads")
                                .tags(tags)
                                .register(meterRegistry);
                        Gauge.builder("dubbo.thread.pool.taskCount", tp, ThreadPoolExecutor::getTaskCount)
                                .description("任务总量")
                                //.baseUnit("threads")
                                .tags(tags)
                                .register(meterRegistry);
                        Gauge.builder("dubbo.thread.pool.completedTaskCount", tp, ThreadPoolExecutor::getCompletedTaskCount)
                                .description("已完成的任务量")
                                //.baseUnit("threads")
                                .tags(tags)
                                .register(meterRegistry);
                    }
                });

            }
        } catch (Exception e) {
            log.error("e:", e);
        }
    }

    @Override
    public void onApplicationEvent(ServiceBeanExportedEvent event) {
        // 等dubbo某一个service export操作完毕后,会通知到这里,此时dubbo的线程池肯定也就初始化好了
        init();
    }
}
果然,这样就拿到了初始化好的dubbo线程池了
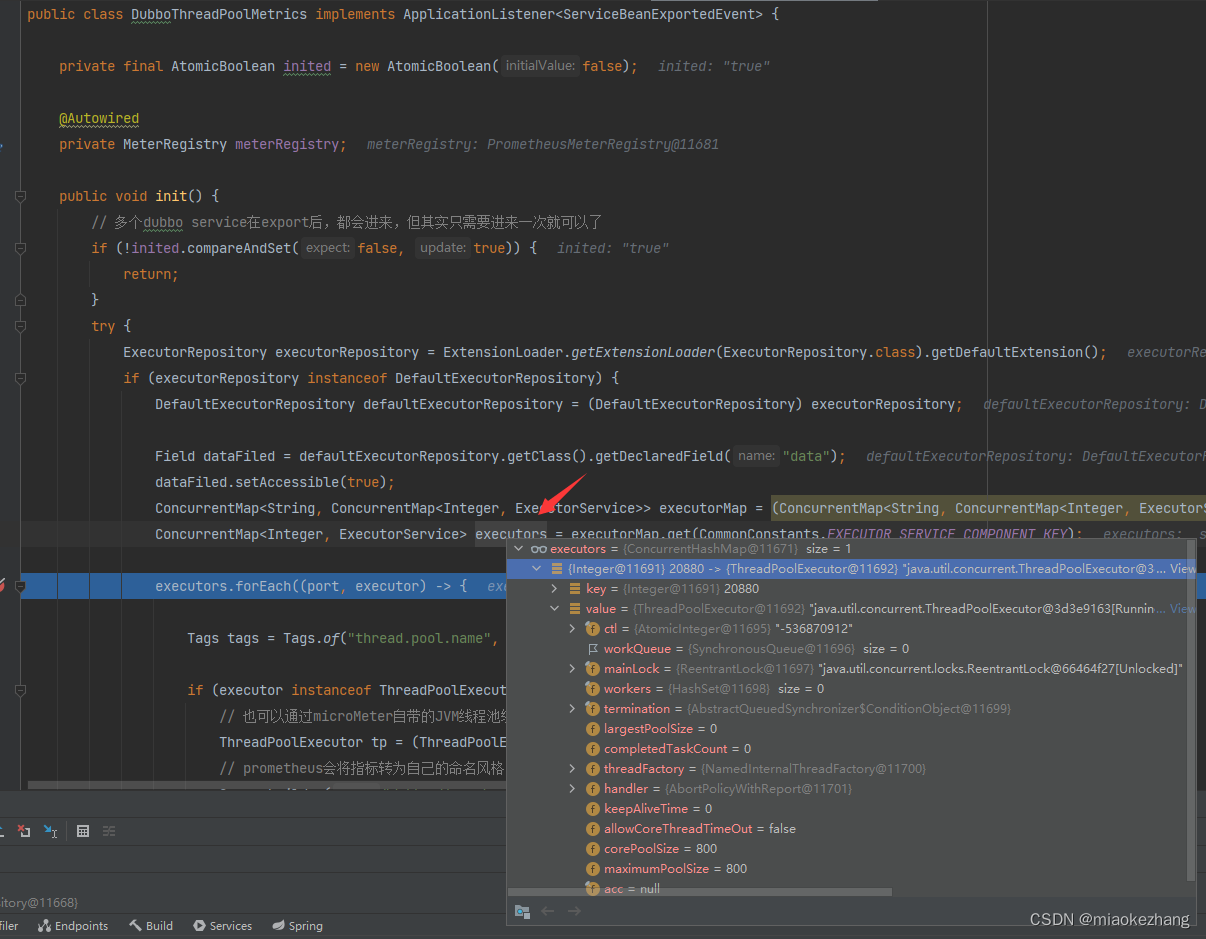
代码里用了一个AtomicBoolean inited变量,因为一个项目里大概率是有多个service的,每一个service都会去做export操作,所以这里的onApplicationEvent方法,会进来多次,但实际上netty进程只会创建一次,就是在第一个service的export动作里完成的,所以只要第一个通知进来,就可以了。
项目启动后,通过调用http://localhost:9953/actuator/prometheus拿到指标数据
.....
# HELP dubbo_thread_pool_core_size 核心线程数
# TYPE dubbo_thread_pool_core_size gauge
dubbo_thread_pool_core_size{application="demo-service",port="20880",thread_pool_name="dubboThreadPool",} 800.0

# HELP dubbo_thread_pool_thread_count 当前线程数
# TYPE dubbo_thread_pool_thread_count gauge
dubbo_thread_pool_thread_count{application="demo-service",port="20880",thread_pool_name="dubboThreadPool",} 0.0

# HELP dubbo_thread_pool_max_size 最大线程数
# TYPE dubbo_thread_pool_max_size gauge
dubbo_thread_pool_max_size{application="demo-service",port="20880",thread_pool_name="dubboThreadPool",} 800.0

# HELP dubbo_thread_pool_queue_size 队列大小
# TYPE dubbo_thread_pool_queue_size gauge
dubbo_thread_pool_queue_size{application="demo-service",port="20880",thread_pool_name="dubboThreadPool",} 0.0

# HELP dubbo_thread_pool_completedTaskCount 已完成的任务量
# TYPE dubbo_thread_pool_completedTaskCount gauge
dubbo_thread_pool_completedTaskCount{application="demo-service",port="20880",thread_pool_name="dubboThreadPool",} 0.0

# HELP dubbo_thread_pool_largest_size 历史最高线程数
# TYPE dubbo_thread_pool_largest_size gauge
dubbo_thread_pool_largest_size{application="demo-service",port="20880",thread_pool_name="dubboThreadPool",} 0.0

# HELP dubbo_thread_pool_taskCount 任务总量
# TYPE dubbo_thread_pool_taskCount gauge
dubbo_thread_pool_taskCount{application="demo-service",port="20880",thread_pool_name="dubboThreadPool",} 0.0

# HELP dubbo_thread_pool_active_size 活跃线程数
# TYPE dubbo_thread_pool_active_size gauge
dubbo_thread_pool_active_size{application="demo-service",port="20880",thread_pool_name="dubboThreadPool",} 0.0
最后把这些指标设置到grafana上,看下监控面板


 2374
2374

 被折叠的 条评论
为什么被折叠?
被折叠的 条评论
为什么被折叠?
 到【灌水乐园】发言


