


打印工具
#include <type_traits>
#include <stdlib.h>
// 用于打印gpu上的数据,在开发自定义算子的时候,需要打印gpu上的操作是否有问题时,用到
template <typename T>
__global__ void  print_gpu(T* data,  int size) {
   for (int j = 0; j < size; j++) {
        // image row
        T *row = (T*)((char*)data + j*4);
        if (std::is_same<T, float>::value) {
					printf("|%.2f", (*row == 0.0)? 0.0 : *row);
			 } else {
			 		printf("|%d", (*row == 0)? 0 : *row);
			 }
    }
    printf("\n");
}

template <typename T>
void print_gpu_data(T* data, int size) {
    print_gpu<T><<<1,1>>>(data, size);
    cudaDeviceSynchronize();
}

template void print_gpu_data(float* data, int size);
template void print_gpu_data(int* data, int size);
传输到cpu再打印的方式
#include <type_traits>
#include <stdlib.h>
template<typename T>
void print_gpu(T* a_gpu, const int& num) {
  T b[num];
  CUDA_CHECK(cudaMemcpy(b, a_gpu, num * sizeof(T), cudaMemcpyDeviceToHost));   // 设备到主机

  for(int i = 0; i < num; i++){
    std::cout << b[i] << "|";
  }
  std::cout <<std::endl;
}
template void print_gpu(float* data, const int& num);
template void print_gpu(int* data, const int& num);
性能分析测试工具
CUDA 11包括Compute Sanitizer,这是下一代的功能正确性检查工具,可对越界内存访问和竞争条件提供运行时检查。Compute Sanitizer旨在替代该cuda-memcheck工具。
nsight system
- 简单说明如何使用,如果需要再进一步查询文档。
注意事项: 就是rep用nsight中的UI查看时,需要每次关闭窗口,否则无法自动更新
打开UI界面
用于可视化nsys工具执行保存的report文件
在安装目录下的bin中执行nsys-ui,通过左上角工具栏file中找到open子菜单,查找****.nsys-rep文件打开即可
使用情况
function run_profile() {
    if [ ! -e /opt/nvidia/nsight-systems/2022.4.1/bin/nsys ];then
        chmod +x NsightSystems-linux-public-2022.4.1.21-0db2c85.run
        ./NsightSystems-linux-public-2022.4.1.21-0db2c85.run
        cd -
    fi

    cd ${WS}/bin

    if [ -z $1 ]; then
        WARNING "your need add which app you want to profile? like './build.sh profile your_app'"
        exit 1
    fi
    # 注意trace后的参数,这样能检查nvidia的多个库函数情况
    # --force-overwrite ,--output=report-name 输出时每次都覆盖旧的;建议名字指定app名。
    # 后面三个memory相关的,用于看显存使用量,根据多次循环调用,可以检查泄露情况
    /opt/nvidia/nsight-systems/2022.4.1/bin/nsys profile \
        --trace=cuda,nvtx,cublas,cublas-verbose,cusparse,cusparse-verbose,cudnn,opengl,nvtx,osrt \
        --force-overwrite=true \
        --output=$1 \
        --cuda-memory-usage=true \
        --cuda-um-cpu-page-faults=true \
        --cuda-um-gpu-page-faults=true  \
        --cudabacktrace=all $1
    cd -
}
扩展阅读:
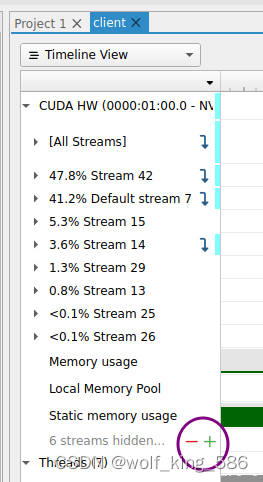
查看应用中使用stream的情况
- 如紫色圈中,通过点击+号,可以展开所有的stream情况
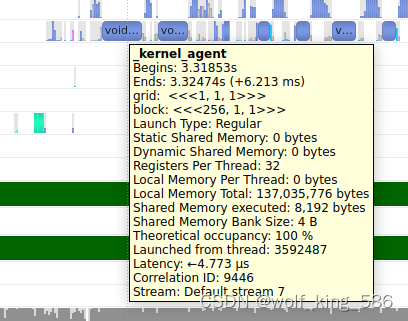
- 将鼠标放到制定的kernel算子上,会有执行时间和stream的信息, 如下图所示
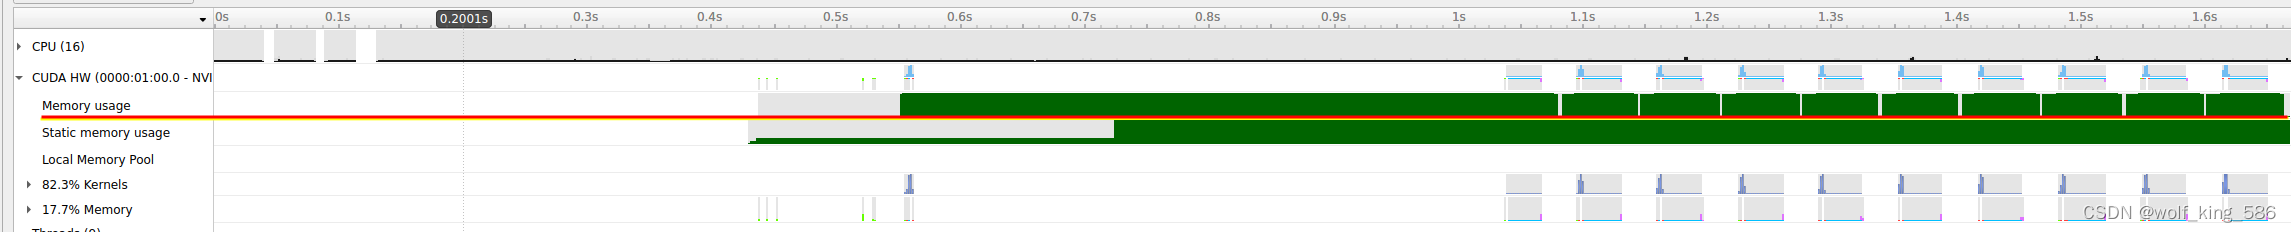
- 查看内存泄露情况, 根据红线这一栏,可以看到多次循环下,显存使用的涨幅情况,并且可以展开,看那个函数执行阶段,显存有涨幅,而且下一个循环没有被释放掉,通过计算涨幅情况,可以检查出哪个函数有泄露问题
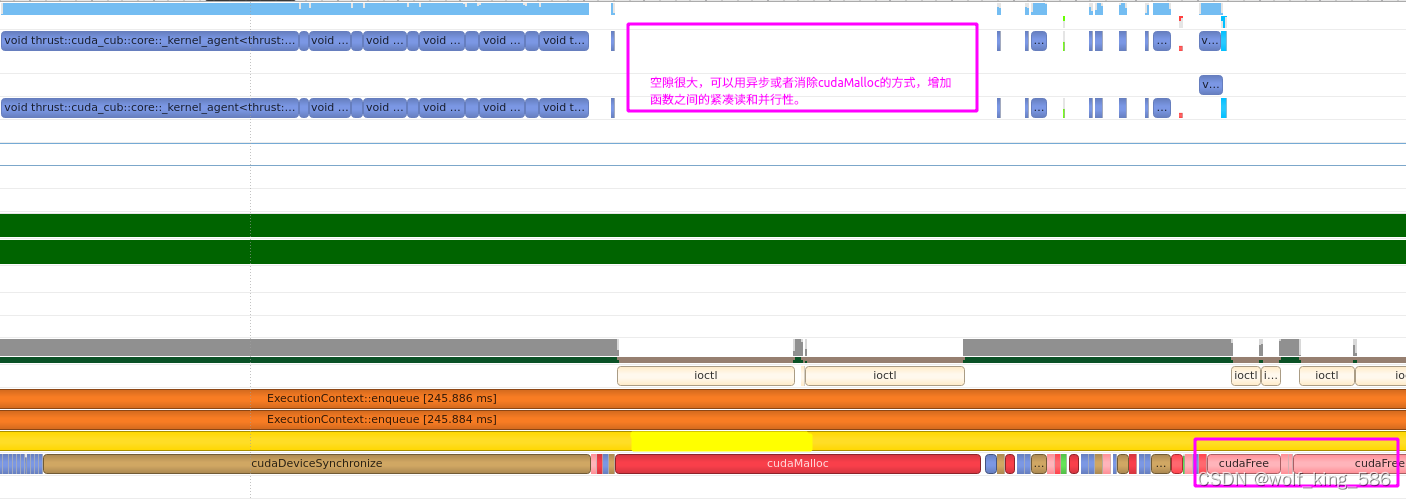
- 查阅函数中kernel函数调用的紧凑度和并行性: 如下图所示,我们发现一些函数之间存在很大的一个cudaMalloc耗时,导致函数的稀疏性很高,可以利用异步cudaMalloc或者类似tensorRT的workspace机制,消除这部分的消耗;另外很多其他函数之间的空隙,可以查看是什么造成的可以找对应的方法消除。
- cudaFree的耗时也不少,可以考虑用异步的cudaFree
-注意nsight中自带对cpu的评测,不需要额外工具,但是一般需要sudo权限,否则不会对cpu进行采样监控: https://docs.nvidia.com/nsight-systems/UserGuide/index.html?highlight=CPU%20utilization#cpu-profiling-on-linux
使用launch/start/stop来评测性能
因为有的时候,profile需要root权限,而且会录制大量的评测数据,对于大应用来说不太友好,所以需要考虑用launch+start+stop的方式多次获取小段时间内的性能指标
- launch启动后,可以通过start来获取性能指标,stop来保存性能指标到nsys-rep文件
- 此外,这个评测在非root下没办法获取gpu详细的占用情况指标,但是也能给出很多价值信息。
#!/bin/bash

function launch() {
    echo "launch"
    /opt/nvidia/nsight-systems/2024.4.1/bin/nsys launch \
    --cuda-memory-usage=true \
    --trace=cuda,nvtx,cublas,cudnn \
    application_cmd args
}

function start() {
    echo "start"
    /opt/nvidia/nsight-systems/2024.4.1/bin/nsys start \
    --backtrace=lbr  \
    --cpuctxsw=process-tree  \
    --gpuctxsw=true \
    --os-events=0,1,2 \
    --output=test_cpu \
    --sample=process-tree \
    --samples-per-backtrace=2 \
    --stats=true \
    --force-overwrite=true
}

function stop() {
    echo "stop"
    /opt/nvidia/nsight-systems/2024.4.1/bin/nsys stop
}

function shutdown() {
    echo "shutdown"
    /opt/nvidia/nsight-systems/2024.4.1/bin/nsys shutdown
}

$@
nsight compute
- https://zhuanlan.zhihu.com/p/463435348
- https://blog.csdn.net/UCAS_HMM/article/details/126514127?spm=1001.2101.3001.6650.3&utm_medium=distribute.pc_relevant.none-task-blog-2%7Edefault%7EYuanLiJiHua%7EPosition-3-126514127-blog-109179938.pc_relevant_default&depth_1-utm_source=distribute.pc_relevant.none-task-blog-2%7Edefault%7EYuanLiJiHua%7EPosition-3-126514127-blog-109179938.pc_relevant_default&utm_relevant_index=4
- https://blog.csdn.net/LostUnravel/article/details/138034380#t18
- 重要的官方文档,用于说明一些kernel的评测指标代表什么含义:https://docs.nvidia.com/nsight-compute/ProfilingGuide/index.html#metrics-reference
nsight system与nsight compute
在2024版本后,可以直接通过nsight system中点击kernel右键,就可以跳转到对应的compute中, 注意这个时候要选择好nsight compute和对应的lib链接,这个lib必须是对应的nsight compute UI文件夹下的target文件夹中的lib, 否则会导致kernel分析失败
nsight compute的一些关键指标
- Stall mio Throttle: 包括特殊的数学指令、动态分支以及共享内存指令。
- 官方说明:smsp__pcsamp_warps_issue_stalled_mio_throttle: Warp was stalled waiting for the MIO (memory input/output) instruction queue to be not full. This stall reason is high in cases of extreme utilization of the MIO pipelines, which include special math instructions, dynamic branches, as well as shared memory instructions. When caused by shared memory accesses, trying to use fewer but wider loads can reduce pipeline pressure."
- 这个很高的话可能说明很多kernel线程通过syncthreads在等待数据到达或者回写,可以考虑通过memasyc或者双缓冲的方式缓解数据copy带来的延迟;
SM和内存使用之间不同情况需要的处理不同
- 在nsight system中对单个kernel右键会有选项可以选择使用nsight compute进行kernel分析
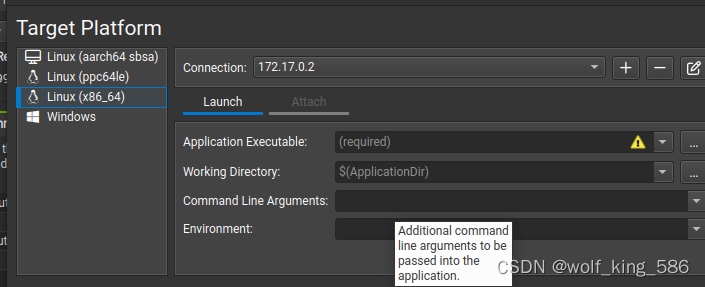
- 在打开nsight compute时,通过ssh可以链接docker里面的环境,如下图所示,connection就是通过ssh方式链接你的开发环境的(可以是docker,可以是服务器)
- Application Executable: 是你的二进制应用文件名
- Working Directory: 是二级制应用所在的目录,你的开发环境中的路径(如docker中/workspace/…目录)
- Command:应该是应用的参数
- Environment: 这个还不知道怎么设置
- 比如:
cub::DeviceSelect::Flagged函数的分析
GPu Speed of Light Throughput 吞吐量的考察
GPU计算和内存资源吞吐量的高级概述。对于每个单元,吞吐量报告相对于理论最大值的利用率百分比。细分显示计算和内存的每个单独子度量的吞吐量,以清楚地识别最高贡献者。GPU的计算和内存资源利用率的高级概述,以屋顶线图的形式呈现。
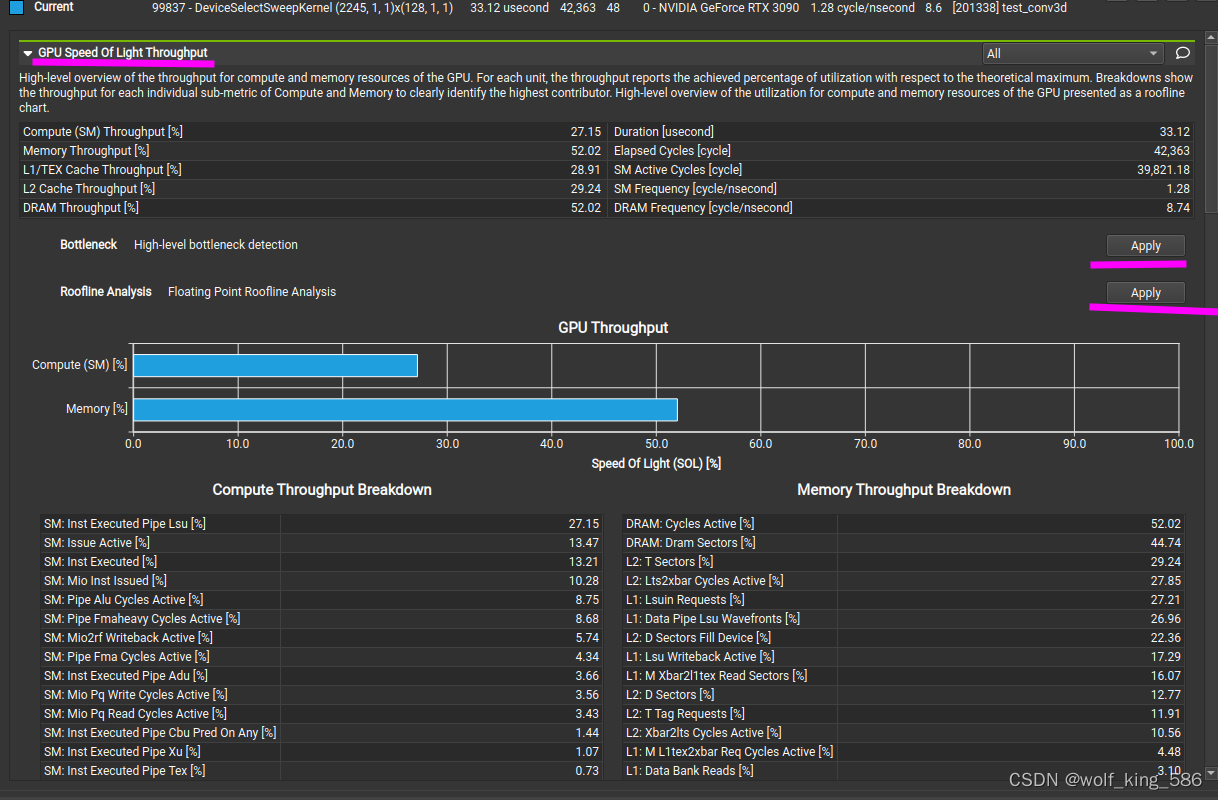 - 然后通过执行其中的apply来查看在吞吐量上kernel是否存在弊端
如提示: This kernel exhibits low compute throughput and memory bandwidth utilization relative to the peak performance of this device. Achieved compute throughput and/or memory bandwidth below 60.0% of peak typically indicate latency issues. Look at Scheduler Statistics and Warp State Statistics for potential reasons.相对于此设备的峰值性能,此内核显示出较低的计算吞吐量和内存带宽利用率。达到的计算吞吐量和/或内存带宽低于峰值的60.0%通常表示延迟问题。看看调度器统计信息和和wrap状态统计(下面有分析)查看潜在的问题。
Compute Workload Analysis 计算量的分析
Detailed analysis of the compute resources of the streaming multiprocessors (SM), including the achieved instructions per clock (IPC) and the utilization of each available pipeline. Pipelines with very high utilization might limit the overall performance.
- 可能存在的问题:All compute pipelines are under-utilized. Either this kernel is very small or it doesn’t issue enough warps per scheduler. 需要看launch statistic
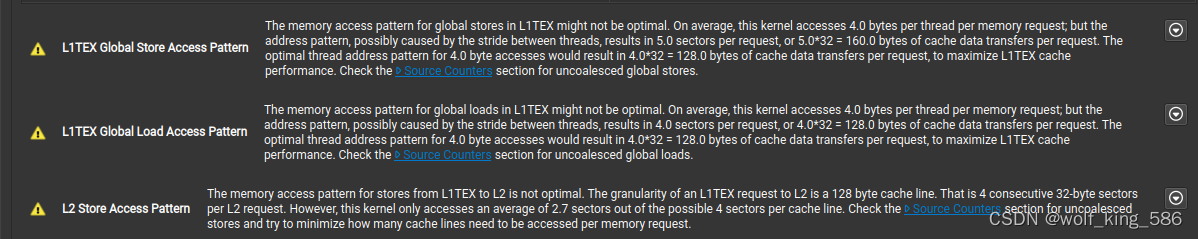
Memory workload Analysis 内存吞吐量分析
- 看内存吞吐量的使用情况,是否存在瓶颈
Detailed analysis of the memory resources of the GPU. Memory can become a limiting factor for the overall kernel performance when fully utilizing the involved hardware units (Mem Busy), exhausting the available communication bandwidth between those units (Max Bandwidth), or by reaching the maximum throughput of issuing memory instructions (Mem Pipes Busy). Detailed chart of the memory units. Detailed tables with data for each memory unit. GPU内存资源的详细分析。当充分利用所涉及的硬件单元(Mem Busy)、耗尽这些单元之间的可用通信带宽(Max bandwidth)或达到发出内存指令的最大吞吐量(Mem Pipes Busy)时,内存可能会成为整个内核性能的限制因素。内存单元的详细图表。每个存储单元的详细数据表
- 可能存在的问题: 如下图所示:1. 全局存储的内存访问模式可能不是最佳的, 2. 全局加载的内存访问模式可能不是最佳的; 3. 尝试最小化每个内存请求需要访问的缓存行数
scheduler statistic: Wraper调度的情况
Summary of the activity of the schedulers issuing instructions. Each scheduler maintains a pool of warps that it can issue instructions for. The upper bound of warps in the pool (Theoretical Warps) is limited by the launch configuration. On every cycle each scheduler checks the state of the allocated warps in the pool (Active Warps). Active warps that are not stalled (Eligible Warps) are ready to issue their next instruction. From the set of eligible warps the scheduler selects a single warp from which to issue one or more instructions (Issued Warp). On cycles with no eligible warps, the issue slot is skipped and no instruction is issued. Having many skipped issue slots indicates poor latency hiding.
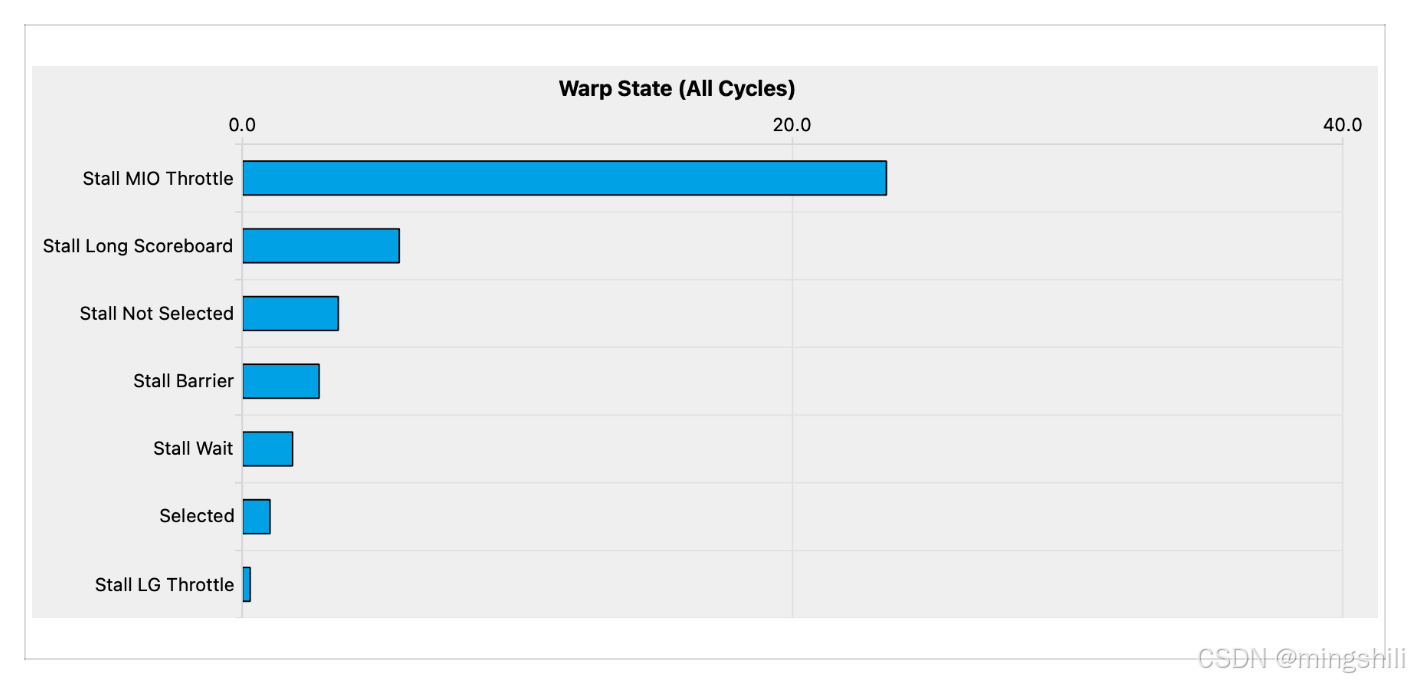
wrap State statistic
Analysis of the states in which all warps spent cycles during the kernel execution. The warp states describe a warp’s readiness or inability to issue its next instruction. The warp cycles per instruction define the latency between two consecutive instructions. The higher the value, the more warp parallelism is required to hide this latency. For each warp state, the chart shows the average number of cycles spent in that state per issued instruction. Stalls are not always impacting the overall performance nor are they completely avoidable. Only focus on stall reasons if the schedulers fail to issue every cycle. When executing a kernel with mixed library and user code, these metrics show the combined values.
- 可能的问题:On average, each warp of this kernel spends 83.4 cycles being stalled waiting for a scoreboard dependency on a L1TEX (local, global, surface, texture, rtcore) operation. This represents about 106.2% of the total average of 78.6 cycles between issuing two instructions. To reduce the number of cycles waiting on L1TEX data accesses verify the memory access patterns are optimal for the target architecture, attempt to increase cache hit rates by increasing data locality or by changing the cache configuration, and consider moving frequently used data to registers and to shared memory.
Instruction Statistic
Statistics of the executed low-level assembly instructions (SASS). The instruction mix provides insight into the types and frequency of the executed instructions. A narrow mix of instruction types implies a dependency on few instruction pipelines, while others remain unused. Using multiple pipelines allows hiding latencies and enables parallel execution. Note that ‘Instructions/Opcode’ and ‘Executed Instructions’ are measured differently and can diverge if cycles are spent in system calls.
occupancy: SM占有率
Occupancy is the ratio of the number of active warps per multiprocessor to the maximum number of possible active warps. Another way to view occupancy is the percentage of the hardware’s ability to process warps that is actively in use. Higher occupancy does not always result in higher performance, however, low occupancy always reduces the ability to hide latencies, resulting in overall performance degradation. Large discrepancies between the theoretical and the achieved occupancy during execution typically indicates highly imbalanced workloads.
source Counters: 源度量
Source metrics, including branch efficiency and sampled warp stall reasons. Warp Stall Sampling metrics are periodically sampled over the kernel runtime. They indicate when warps were stalled and couldn’t be scheduled. See the documentation for a description of all stall reasons. Only focus on stalls if the schedulers fail to issue every cycle. 分支效率和wrap stall 的原因.


 1126
1126

 被折叠的 条评论
为什么被折叠?
被折叠的 条评论
为什么被折叠?
 到【灌水乐园】发言


