


需要用一个Bubble Chart, 但生成的Bubble似乎直径太大,图形上根本看不出是个圆圈,代码如下:
生成的图形如下:
- package demo;
- import java.awt.Color;
- import javax.swing.JPanel;
- import org.jfree.chart.ChartFactory;
- import org.jfree.chart.ChartPanel;
- import org.jfree.chart.JFreeChart;
- import org.jfree.chart.axis.NumberAxis;
- import org.jfree.chart.plot.PlotOrientation;
- import org.jfree.chart.plot.XYPlot;
- import org.jfree.chart.renderer.xy.XYItemRenderer;
- import org.jfree.data.xy.DefaultXYZDataset;
- import org.jfree.data.xy.XYZDataset;
- import org.jfree.ui.ApplicationFrame;
- import org.jfree.ui.RefineryUtilities;
- /**
- * A bubble chart demo.
- */
- public class BubbleChartDemo1 extends ApplicationFrame {
- /**
- * A demonstration application showing a bubble chart.
- *
- * @param title the frame title.
- */
- public BubbleChartDemo1(String title) {
- super(title);
- JPanel chartPanel = createDemoPanel();
- chartPanel.setPreferredSize(new java.awt.Dimension(500, 270));
- setContentPane(chartPanel);
- }
- /**
- * Creates a chart.
- *
- * @param dataset the dataset.
- *
- * @return The chart.
- */
- private static JFreeChart createChart(XYZDataset dataset) {
- JFreeChart chart = ChartFactory.createBubbleChart("Bubble Chart Demo 1", "X", "Y", dataset, PlotOrientation.HORIZONTAL,
- true, true, false);
- XYPlot plot = (XYPlot) chart.getPlot();
- plot.setForegroundAlpha(0.65f);
- XYItemRenderer renderer = plot.getRenderer();
- renderer.setSeriesPaint(0, Color.blue);
- // increase the margins to account for the fact that the auto-range
- // doesn't take into account the bubble size...
- NumberAxis domainAxis = (NumberAxis) plot.getDomainAxis();
- domainAxis.setLowerMargin(0.15);
- domainAxis.setUpperMargin(0.15);
- NumberAxis rangeAxis = (NumberAxis) plot.getRangeAxis();
- rangeAxis.setLowerMargin(0.15);
- rangeAxis.setUpperMargin(0.15);
- return chart;
- }
- /**
- * Creates a sample dataset.
- *
- * @return A sample dataset.
- */
- public static XYZDataset createDataset() {
- DefaultXYZDataset dataset = new DefaultXYZDataset();
- double[] x = { 2.1, 2.3, 2.3 };
- double[] y = { 14.1, 14.1, 12.0 };
- double[] z = { 2.4, 2.7, 2.7 };
- double[][] series = new double[][] { x, y, z };
- dataset.addSeries("Series 1", series);
- return dataset;
- }
- /**
- * Creates a panel for the demo (used by SuperDemo.java).
- *
- * @return A panel.
- */
- public static JPanel createDemoPanel() {
- JFreeChart chart = createChart(createDataset());
- ChartPanel chartPanel = new ChartPanel(chart);
- chartPanel.setDomainZoomable(true);
- chartPanel.setRangeZoomable(true);
- return chartPanel;
- }
- /**
- * Starting point for the demonstration application.
- *
- * @param args ignored.
- */
- public static void main(String[] args) {
- BubbleChartDemo1 demo = new BubbleChartDemo1("Bubble Chart Demo 1");
- demo.pack();
- RefineryUtilities.centerFrameOnScreen(demo);
- demo.setVisible(true);
- }
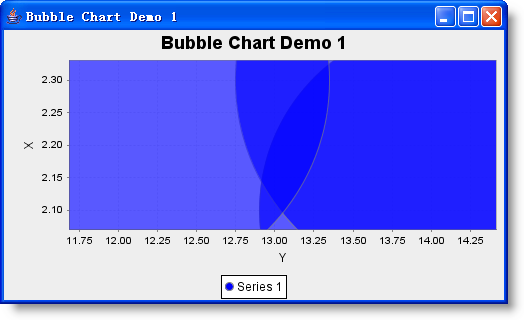
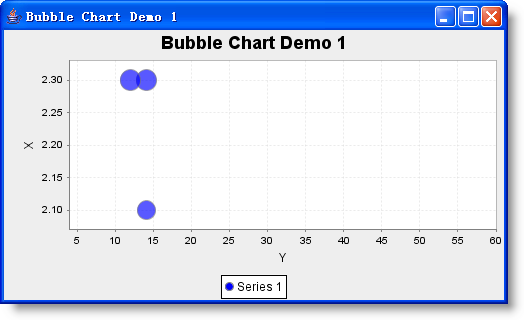
从上图是根本不能看出Series1代表的一系列圆圈(Bubble)。一开始自己总是想着调节Z的范围,使直径变小,后来才发现bubbleChart所使用的XYItemRenderer是XYBubbleRenderer,而构造XYBubbleRenderer的默认scaleType参数正是XYBubbleRenderer.SCALE_ON_RANGE_AXIS,所以应该改变RangeAxis的范围才对,所以需要在上述源代码的59行之后需加入下面一句
- rangeAxis.setRange(4, 60);
这样使得RangeAxis范围变大,即可在图上看到每个Bubble的整体,最后效果图如下:


 1万+
1万+

 被折叠的 条评论
为什么被折叠?
被折叠的 条评论
为什么被折叠?
 到【灌水乐园】发言


