


fontSize: 12
},
itemWidth: 12,
itemHeight: 12
},
xAxis: {
axisTick: {
show: false
},
axisLine: {
lineStyle: {
color: ‘#0092D5’
}
},
axisLabel: {
color: ‘rgba(255, 255, 255, 0.8)’
},
data: [‘2020-01’,‘2020-02’,‘2020-03’,‘2020-04’,‘2020-05’,‘2020-06’]
},
yAxis: {
name: “(吨)”,
nameTextStyle: {
color: ‘rgba(255, 255, 255, 0.8)’,
align: ‘right’
},
splitLine: {
lineStyle: {
type: ‘dashed’,
color: ‘#0092D5’,
opacity: 0.3
}
},
axisLine: {
show: false,
},
axisLabel: {
color: ‘rgba(255, 255, 255, 0.8)’
},
},
grid: {
top: ‘20%’,
bottom: ‘10%’,
left: ‘10%’,
right: ‘2%’
},
series: [{
name: “综采1”,
barWidth: 15,
type: ‘bar’,
data: [1,2,3,4,5,6],
itemStyle: {
normal: {
label: {
show: true, //开启显示
position: ‘insideLeft’, //在上方显示
offset: [-8, 0],
textStyle: { //数值样式
color: ‘#fff’,
fontSize: 10
}
},
color: new echarts.graphic.LinearGradient(0, 1, 0, 0, [{
offset: 0,
color: “#0069F5” // 0% 处的颜色
}, {
offset: 1,
color: “#35C3FF” // 100% 处的颜色
}], false)
}
},
}, {
name: “综采2”,
barWidth: 15,
type: ‘bar’,
data: [3,4,5,6,7,8],
itemStyle: {
normal: {
label: {
show: true, //开启显示
position: ‘insideRight’, //在上方显示
offset: [8, 0],
textStyle: { //数值样式
color: ‘#fff’,
fontSize: 10
}
},
color: new echarts.graphic.LinearGradient(0, 1, 0, 0, [{
offset: 0,
color: “#03AC32” // 0% 处的颜色
}, {
offset: 1,
color: “#69EF00” // 100% 处的颜色
}], false)
}
},
}, {
name: “总计”,
barWidth: 15,
type: ‘line’,
color: ‘#f67a03’,
data: [8,9,10,11,12,13],
}]
};
option = {
color: [‘#acff02’, ‘#fac800’, ‘#ff7d00’, ‘#0fb42c’],
tooltip: {
trigger: ‘axis’,
axisPointer: { // Use axis to trigger tooltip
type: ‘shadow’ // ‘shadow’ as default; can also be ‘line’ or ‘shadow’
}
},
legend: {
show: true,
top: 15,
right: 0,
x: ‘center’,
y: ‘top’,
data: [“生产队1”,“生产队2”,“生产队3”, “总计”],
textStyle: {
color: ‘rgba(255, 255, 255, 0.8)’,
fontSize: 12
},
itemWidth: 12,
itemHeight: 12
},
xAxis: {
axisTick: {
show: false
},
axisLine: {
lineStyle: {
color: ‘#0092D5’
}
},
axisLabel: {
color: ‘rgba(255, 255, 255, 0.8)’
},
data: [‘2020-01’,‘2020-02’,‘2020-03’,‘2020-04’,‘2020-05’,‘2020-06’]
},
yAxis: {
name: “(吨)”,
nameTextStyle: {
color: ‘rgba(255, 255, 255, 0.8)’,
align: ‘right’
},
splitLine: {
lineStyle: {
type: ‘dashed’,
color: ‘#0092D5’,
opacity: 0.3
}
},
axisLine: {
show: false,
},
axisLabel: {
color: ‘rgba(255, 255, 255, 0.8)’
},
},
grid: {
top: ‘25%’,
bottom: ‘10%’,
left: ‘12%’,
right: ‘2%’
},
series: [{
name: “生产队1”,
barWidth: 15,
type: ‘bar’,
stack: ‘total’,
emphasis: {
focus: ‘series’
},
data: [1,2,3,4,5,6],
itemStyle: {
normal: {
label: {
show: true, //开启显示
position: ‘insideRight’, //在上方显示
offset: [-8, 0],
textStyle: { //数值样式
color: ‘#fff’,
fontSize: 10
}
},
}
},
},
{
name: “生产队2”,
barWidth: 15,
type: ‘bar’,
stack: ‘total’,
emphasis: {
focus: ‘series’
},
data:[2,3,4,5,6,7],
itemStyle: {
normal: {
label: {
show: true, //开启显示
position: ‘insideRight’, //在上方显示
offset: [-8, 0],
textStyle: { //数值样式
color: ‘#fff’,
fontSize: 10,
}
},
}
},
},
{
name: “生产队3”,
barWidth: 15,
type: ‘bar’,
stack: ‘total’,
emphasis: {
focus: ‘series’
},
data:[5,6,7,8,9,10],
itemStyle: {
normal: {
label: {
show: true, //开启显示
position: ‘insideRight’, //在上方显示
offset: [-8, 0],
textStyle: { //数值样式
color: ‘#fff’,
fontSize: 10
}
},
}
},
}, {
name: ‘总计’,
barWidth: 15,
type: ‘bar’,
data: [21,22,23,34,25,25],
itemStyle: {
normal: {
label: {
show: true, //开启显示
position: ‘insideLeft’, //在上方显示
offset: [8, 0],
textStyle: { //数值样式
color: ‘#fff’,
fontSize: 10
}
},
color: new echarts.graphic.LinearGradient(0, 1, 0, 0, [{
offset: 0,
color: “#0069F5” // 0% 处的颜色
}, {
offset: 1,
color: “#35C3FF” // 100% 处的颜色
}], false)
}
},
}]
};
option = {
title: {
text: ‘各生产队工效’,
textAlign: ‘left’,
x: ‘center’,
y: ‘top’,
top: ‘7%’,
textStyle: {
color: ‘rgba(255, 255, 255, 0.8)’,
fontSize: 12
}
},
tooltip: {},
legend: {
orient: ‘vertical’,
top: ‘50%’,
left: ‘15%’,
textStyle: {
color: ‘rgba(255, 255, 255, 0.8)’,
fontSize: 12
},
itemWidth: 12,
itemHeight: 12
},
grid: {
top: ‘20%’,
bottom: ‘10%’,
left: ‘10%’,
right: ‘10%’
},
series: [{
name: ‘功效’,
type: ‘pie’,
radius: [15, 70],
center: [‘68%’, ‘60%’],
// roseType: ‘area’,
itemStyle: {
borderRadius: 2
},
label: {
position: ‘inside’,
formatter: ‘{c}吨/人天’,
fontWeight: 600,
color: ‘#fff’
},
data: [{
value:12,
name: “生产队1”
},{
value:34,
name: “生产队2”
},{
value:23,
name: “生产队3”
}]
}]
};
option = {
color: [‘#414f5b’, ‘#1890ff’],
series: [
{
name: ‘任务进度’,
type: ‘pie’,
radius: [‘75%’, ‘100%’],
avoidLabelOverlap: false,
hoverAnimation: false,
labelLine: {
normal: {
show: false
}
},
data: [{
value: 25,
label: {
normal: {
show: false,
}
}
}, { // 数据值
value: 75,
// 数据项名称
name: “采煤机开机率”,
//该数据项是否被选中
selected: false,
// 单个扇区的标签配置
label: {
// 是显示标签
show: true,
position: ‘center’,
fontSize: 14,
color: ‘#fff’,
lineHeight: 15,
formatter: '\n{b}\n\n ’ + {a| {c} } + ‘\n\n%’,
rich: {
a: {
color: ‘#1890ff’,
fontSize: 30,
fontWeight: 600,
}
}
},
}]
}
]
};
option = {
color: [‘#fa0145’, ‘#02f8f9’],
tooltip: {
show: true
},
radar: {
nameGap: 7,
axisLine: {
lineStyle: {
color: ‘#0781c0’,
type: ‘dashed’
}
},
name: {
color: ‘#fff’
},
splitLine: {
lineStyle: {
color: ‘#0781c0’,
type: ‘dashed’
}
},
splitArea: {
show: false,
areaStyle: {
color: ‘rgba(255,0,0,0)’, // 图表背景的颜色
},
},
indicator: [“人员”,“设备”,“环境”,“管理”]
},
series: [{
name: ‘’,
type: ‘radar’,
data: [
{
value: //[4200, 3000, 20000, 35000],
name: ‘’,
areaStyle: {
color: ‘#fa0145’,
opacity: 0.1,
},
itemStyle: { // 折线拐点标志的样式。
normal: { // 普通状态时的样式
lineStyle: {
width: 1
},
opacity: 0.2
},
emphasis: { // 高亮时的样式
lineStyle: {
width: 5
},
opacity: 1
}
},
},
{
value: [6200, 2000, 30000, 25000],
name: ‘风险评估’,
areaStyle: {
color: ‘#02f8f9’,
opacity: 0.1,
},
itemStyle: { // 折线拐点标志的样式。
normal: { // 普通状态时的样式
lineStyle: {
width: 1
},
自我介绍一下,小编13年上海交大毕业,曾经在小公司待过,也去过华为、OPPO等大厂,18年进入阿里一直到现在。
深知大多数前端工程师,想要提升技能,往往是自己摸索成长或者是报班学习,但对于培训机构动则几千的学费,着实压力不小。自己不成体系的自学效果低效又漫长,而且极易碰到天花板技术停滞不前!
因此收集整理了一份《2024年Web前端开发全套学习资料》,初衷也很简单,就是希望能够帮助到想自学提升又不知道该从何学起的朋友,同时减轻大家的负担。


既有适合小白学习的零基础资料,也有适合3年以上经验的小伙伴深入学习提升的进阶课程,基本涵盖了95%以上前端开发知识点,真正体系化!
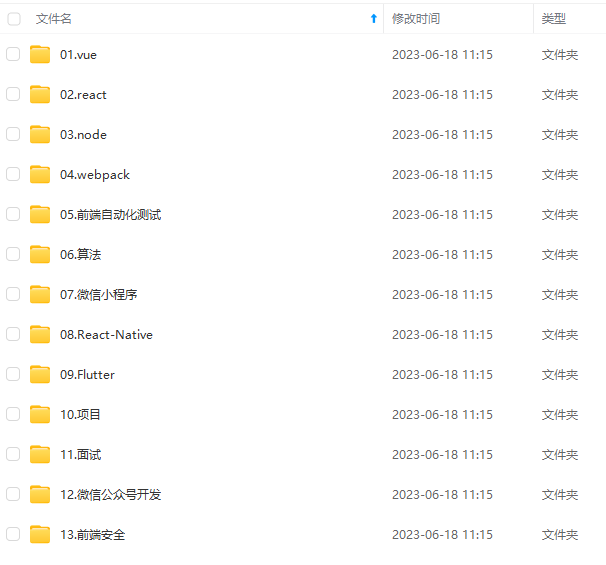
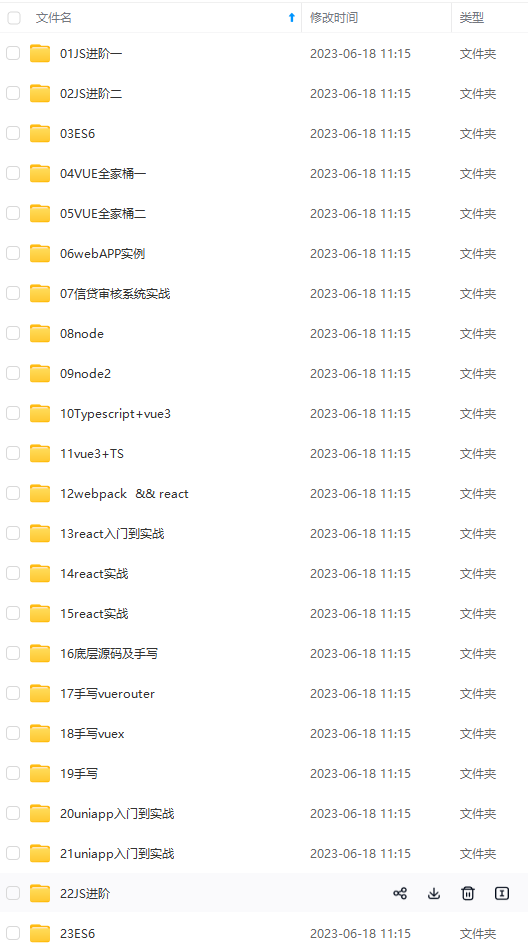
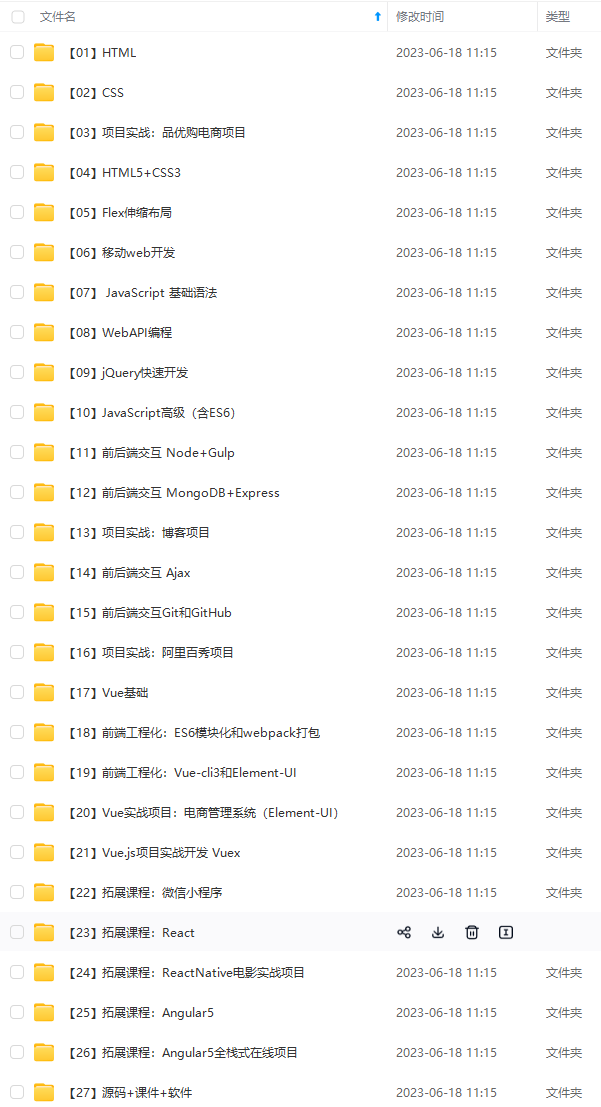
由于文件比较大,这里只是将部分目录大纲截图出来,每个节点里面都包含大厂面经、学习笔记、源码讲义、实战项目、讲解视频,并且后续会持续更新
如果你觉得这些内容对你有帮助,可以添加V获取:vip1024c (备注前端)

最后更多分享:前端字节跳动真题解析

风险评估’,
areaStyle: {
color: ‘#02f8f9’,
opacity: 0.1,
},
itemStyle: { // 折线拐点标志的样式。
normal: { // 普通状态时的样式
lineStyle: {
width: 1
},
自我介绍一下,小编13年上海交大毕业,曾经在小公司待过,也去过华为、OPPO等大厂,18年进入阿里一直到现在。
深知大多数前端工程师,想要提升技能,往往是自己摸索成长或者是报班学习,但对于培训机构动则几千的学费,着实压力不小。自己不成体系的自学效果低效又漫长,而且极易碰到天花板技术停滞不前!
因此收集整理了一份《2024年Web前端开发全套学习资料》,初衷也很简单,就是希望能够帮助到想自学提升又不知道该从何学起的朋友,同时减轻大家的负担。
[外链图片转存中…(img-fWsHqacw-1711967204264)]
[外链图片转存中…(img-SiqEWiXH-1711967204265)]
[外链图片转存中…(img-J9sENImi-1711967204265)]
[外链图片转存中…(img-O71t9SDj-1711967204266)]
[外链图片转存中…(img-yGmhLj8k-1711967204266)]
[外链图片转存中…(img-VCDgtk27-1711967204267)]
既有适合小白学习的零基础资料,也有适合3年以上经验的小伙伴深入学习提升的进阶课程,基本涵盖了95%以上前端开发知识点,真正体系化!
由于文件比较大,这里只是将部分目录大纲截图出来,每个节点里面都包含大厂面经、学习笔记、源码讲义、实战项目、讲解视频,并且后续会持续更新
如果你觉得这些内容对你有帮助,可以添加V获取:vip1024c (备注前端)
[外链图片转存中…(img-Eq45YQRz-1711967204267)]
最后更多分享:前端字节跳动真题解析
- [外链图片转存中…(img-VLYXhUM2-1711967204267)]


 402
402

 被折叠的 条评论
为什么被折叠?
被折叠的 条评论
为什么被折叠?
 到【灌水乐园】发言


