python多子图坐标轴共享

双子图共享Y轴: 

import matplotlib.pyplot as plt
import numpy as np


# First create some toy data:
x = np.linspace(0, 2*np.pi, 400)
y = np.sin(x**2)

# Create two subplots and unpack the output array immediately
f, (ax1, ax2) = plt.subplots(1, 2, sharey=True)
ax1.plot(x, y)
ax1.set_title('Sharing Y axis')
ax2.scatter(x, y)

多子图共享X轴:

# Share a X axis with each column of subplots
plt.subplots(2, 2, sharex='col')
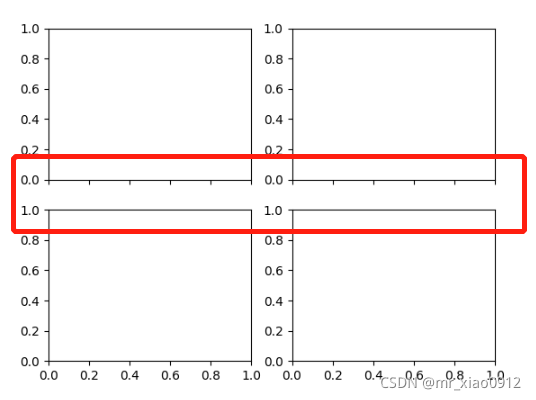
 多子图共享Y轴:

# Share a Y axis with each row of subplots
plt.subplots(2, 2, sharey='row')

多子图共享X-Y轴:

# Share both X and Y axes with all subplots
plt.subplots(2, 2, sharex='all', sharey='all')

 或者:

# Note that this is the same as
plt.subplots(2, 2, sharex=True, sharey=True)

  • 1
    点赞
  • 13
    收藏
    觉得还不错? 一键收藏
  • 0
    评论
对于多子叠加地共用坐标轴的情况,可以使用Matplotlib库来实现。可以先创建一个包含多个子的Figure对象,然后分别在每个子上绘制地并设置不同的坐标轴范围。最后通过调整坐标轴位置和大小来实现地的叠加和共用坐标轴的效果。以下是一个简单的示例代码: ``` import matplotlib.pyplot as plt # 创建包含多个子的Figure对象 fig, axes = plt.subplots(nrows=2, ncols=2, figsize=(10, 10)) # 在每个子上绘制地并设置坐标轴范围 axes[0, 0].plot(x1, y1) axes[0, 0].set_xlim([xmin1, xmax1]) axes[0, 0].set_ylim([ymin1, ymax1]) axes[0, 1].plot(x2, y2) axes[0, 1].set_xlim([xmin2, xmax2]) axes[0, 1].set_ylim([ymin2, ymax2]) axes[1, 0].plot(x3, y3) axes[1, 0].set_xlim([xmin3, xmax3]) axes[1, 0].set_ylim([ymin3, ymax3]) axes[1, 1].plot(x4, y4) axes[1, 1].set_xlim([xmin4, xmax4]) axes[1, 1].set_ylim([ymin4, ymax4]) # 调整坐标轴位置和大小 plt.subplots_adjust(left=0.05, bottom=0.05, right=0.95, top=0.95, wspace=0.1, hspace=0.1) # 显示像 plt.show() ``` 其中,x1、y1、xmin1、xmax1、ymin1、ymax1等变量分别表示第一个子的横轴、纵轴数据和坐标轴范围。其他子同理。调用subplots函数创建Figure对象时,通过nrows和ncols参数可以指定子的行数和列数,通过figsize参数可以指定Figure对象的大小。调用subplots_adjust函数可以调整子之间的间距和坐标轴位置。最后调用show函数显示像。

“相关推荐”对你有帮助么?

  • 非常没帮助
  • 没帮助
  • 一般
  • 有帮助
  • 非常有帮助
提交
评论
添加红包

请填写红包祝福语或标题

红包个数最小为10个

红包金额最低5元

当前余额3.43前往充值 >
需支付:10.00
成就一亿技术人!
领取后你会自动成为博主和红包主的粉丝 规则
hope_wisdom
发出的红包
实付
使用余额支付
点击重新获取
扫码支付
钱包余额 0

抵扣说明:

1.余额是钱包充值的虚拟货币,按照1:1的比例进行支付金额的抵扣。
2.余额无法直接购买下载,可以购买VIP、付费专栏及课程。

余额充值