/* A struct is used to keep track of the series list because later we need to draw to the series in the reverse order to which they were initialised. */typedefstruct{lv_obj_t* obj;lv_chart_series_t* series_list[3];}stacked_area_chart_t;
定义变量
staticstacked_area_chart_t stacked_area_chart;
事件处理函数
/**
* Callback which draws the blocks of colour under the lines
**/staticvoiddraw_event_cb(lv_event_t* e){lv_obj_t* obj =lv_event_get_target(e);// 获取产生事件的对象/*Add the faded area before the lines are drawn*/lv_obj_draw_part_dsc_t* dsc =lv_event_get_draw_part_dsc(e);//获取事件绘制描述符if(dsc->part == LV_PART_ITEMS){//仅对LV_PART_ITEMS处理if(!dsc->p1 ||!dsc->p2)//空指针不处理return;/*Add a line mask that keeps the area below the line*/lv_draw_mask_line_param_t line_mask_param;lv_draw_mask_line_points_init(&line_mask_param, dsc->p1->x, dsc->p1->y, dsc->p2->x, dsc->p2->y,
LV_DRAW_MASK_LINE_SIDE_BOTTOM);// 初时化线条mask参数int16_t line_mask_id =lv_draw_mask_add(&line_mask_param,NULL);//添加mask/*Draw a rectangle that will be affected by the mask*/lv_draw_rect_dsc_t draw_rect_dsc;lv_draw_rect_dsc_init(&draw_rect_dsc);
draw_rect_dsc.bg_opa = LV_OPA_COVER;//透明度为覆盖
draw_rect_dsc.bg_color = dsc->line_dsc->color;//背景色和线条同色lv_area_t a;
a.x1 = dsc->p1->x;
a.x2 = dsc->p2->x;
a.y1 =LV_MIN(dsc->p1->y, dsc->p2->y);//取最小值
a.y2 = obj->coords.y2 -13;/* -13 cuts off where the rectangle draws over the chart margin.Without this an area of 0 doesn't look like 0 */lv_draw_rect(dsc->draw_ctx,&draw_rect_dsc,&a);//绘制矩形区域/*Remove the mask*/lv_draw_mask_free_param(&line_mask_param);//移除mask paramlv_draw_mask_remove_id(line_mask_id);//移除mask id}}
四舍五入处理
/**
* Helper function to round a fixed point number
**/staticint32_tround_fixed_point(int32_t n,int8_t shift){/* Create a bitmask to isolates the decimal part of the fixed point number */int32_t mask =1;for(int32_t bit_pos =0; bit_pos < shift; bit_pos++){
mask =(mask <<1)+1;}int32_t decimal_part = n & mask;/* Get 0.5 as fixed point */int32_t rounding_boundary =1<<(shift -1);/* Return either the integer part of n or the integer part + 1 */return(decimal_part < rounding_boundary)?(n &~mask):((n >> shift)+1)<< shift;}
创建Stacked area chart
/**
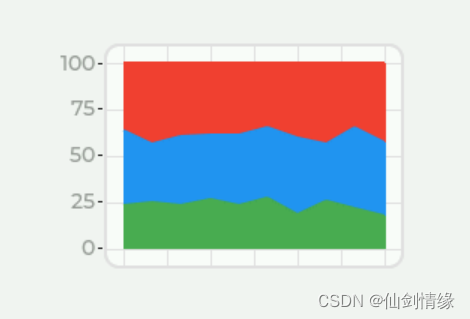
* Stacked area chart
*/staticvoidlv_example_chart_8(void){/*Create a stacked_area_chart.obj*/
stacked_area_chart.obj =lv_chart_create(lv_scr_act());//创建CHART对象lv_obj_set_size(stacked_area_chart.obj,200,150);//设置大小lv_obj_center(stacked_area_chart.obj);//居中显示lv_chart_set_type(stacked_area_chart.obj, LV_CHART_TYPE_LINE);//CHART类型为LV_CHART_TYPE_LINElv_chart_set_div_line_count(stacked_area_chart.obj,5,7);//设置分割线为5x7lv_obj_add_event_cb(stacked_area_chart.obj, draw_event_cb, LV_EVENT_DRAW_PART_BEGIN,NULL);// 添加LV_EVENT_DRAW_PART_BEGIN事件/* Set range to 0 to 100 for percentages. Draw ticks */lv_chart_set_range(stacked_area_chart.obj, LV_CHART_AXIS_PRIMARY_Y,0,100);//设置主Y轴范围为0~100lv_chart_set_axis_tick(stacked_area_chart.obj, LV_CHART_AXIS_PRIMARY_Y,3,0,5,1, true,30);//设置Y轴tick/*Set point size to 0 so the lines are smooth */lv_obj_set_style_size(stacked_area_chart.obj,0, LV_PART_INDICATOR);//LV_PART_INDICATOR对应的size设成0/*Add some data series*/
stacked_area_chart.series_list[0]=lv_chart_add_series(stacked_area_chart.obj,lv_palette_main(LV_PALETTE_RED),
LV_CHART_AXIS_PRIMARY_Y);//第一条红色线添加到CHART
stacked_area_chart.series_list[1]=lv_chart_add_series(stacked_area_chart.obj,lv_palette_main(LV_PALETTE_BLUE),
LV_CHART_AXIS_PRIMARY_Y);//第二条蓝色线添加到CHART
stacked_area_chart.series_list[2]=lv_chart_add_series(stacked_area_chart.obj,lv_palette_main(LV_PALETTE_GREEN),
LV_CHART_AXIS_PRIMARY_Y);//第三条绿色线添加到CHARTfor(int point =0; point <10; point++){/* Make some random data */uint32_t vals[3]={lv_rand(10,20),lv_rand(20,30),lv_rand(20,30)};int8_t fixed_point_shift =5;uint32_t total = vals[0]+ vals[1]+ vals[2];uint32_t draw_heights[3];uint32_t int_sum =0;uint32_t decimal_sum =0;/* Fixed point cascade rounding ensures percentages add to 100 */for(int32_t series_index =0; series_index <3; series_index++){//三条线设置数据
decimal_sum +=(((vals[series_index]*100)<< fixed_point_shift)/ total);
int_sum +=(vals[series_index]*100)/ total;int32_t modifier =(round_fixed_point(decimal_sum, fixed_point_shift)>> fixed_point_shift)- int_sum;/* The draw heights are equal to the percentage of the total each value is + the cumulative sum of the previous percentages.
The accumulation is how the values get "stacked" */
draw_heights[series_index]= int_sum + modifier;/* Draw to the series in the reverse order to which they were initialised.
Without this the higher values will draw on top of the lower ones.
This is because the Z-height of a series matches the order it was initialised */lv_chart_set_next_value(stacked_area_chart.obj, stacked_area_chart.series_list[3- series_index -1],
draw_heights[series_index]);}}lv_chart_refresh(stacked_area_chart.obj);//刷新显示}


 3840
3840


 被折叠的 条评论
为什么被折叠?
被折叠的 条评论
为什么被折叠?
 到【灌水乐园】发言


