


1. 项目场景
host os:ubuntu 20.04.3 LTS
docker: docker-ce-20.10.14
cloud: openstack
ceph: 15.2.16(octopus)
2. 问题描述及原因分析
2.1 问题描述及原因分析
基于分布式存储创建的虚拟机部署了k8s集群,发现k8s集群存在几点异常如下:
- kubectl get node获取节点信息消耗14s
- ETCD 集群内部关键信息:time too long
针对以上问题,由于分布式存储服务器配置都很高,通过top、free等命令查看CPU和内存情况均良好,初步排除了CPU、内存等问题,最后落到了磁盘上,在虚拟机中通过fio测试,命令如下:
fio --filename=/opt/fio-test --direct=1 --rw=randwrite --refill_buffers --norandommap --randrepeat=0 --ioengine=libaio --bs=4k --size=10G --iodepth=1 --numjobs=16 --runtime=600 --group_reporting --name=randwrite_4k
fio --filename=/opt/fio-test --direct=1 --rw=randrw --refill_buffers --norandommap --randrepeat=0 --ioengine=libaio --bs=4k --size=10G --rwmixread=70 --iodepth=1 --numjobs=16 --runtime=600 --group_reporting --name=randrw_4k
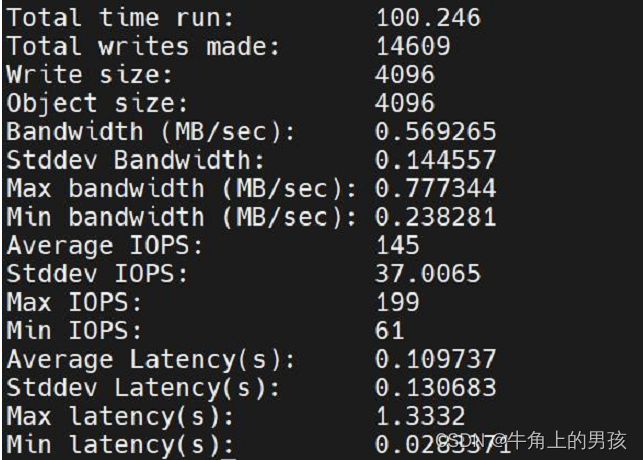
测试出来的iops值非常低,说明虚拟机硬盘性能存在异常,由于存储有分布式存储提供,我们转而测试分布式存储,通过ceph自带的rados bench工具进行测试,测试如下:
ceph osd pool create rbdbench 128 128
rados bench -p rbdbench 600 -b 4096 write --no-cleanup
rados bench -p rbdbench 600 seq
rados bench -p rbdbench 600 rand
ceph osd pool rm rbdbench rbdbench --yes-i-really-really-mean-it
以下为写100s的测试结果,从结果看iops特别低,时延也很高。
 通过ceph osd perf查看每个OSD时延如下:
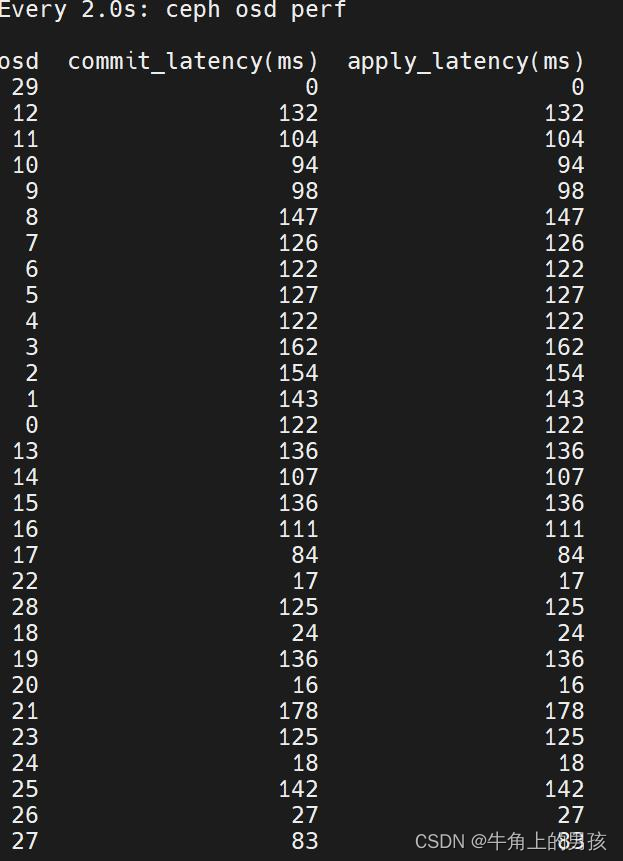 从以上结果及ceph -s查看访问量看,在几乎空载的状态下,每个OSD的时延非常高,怀疑磁盘存在读写瓶颈。下一步则通过工具iostat查看osd磁盘的状态如下:
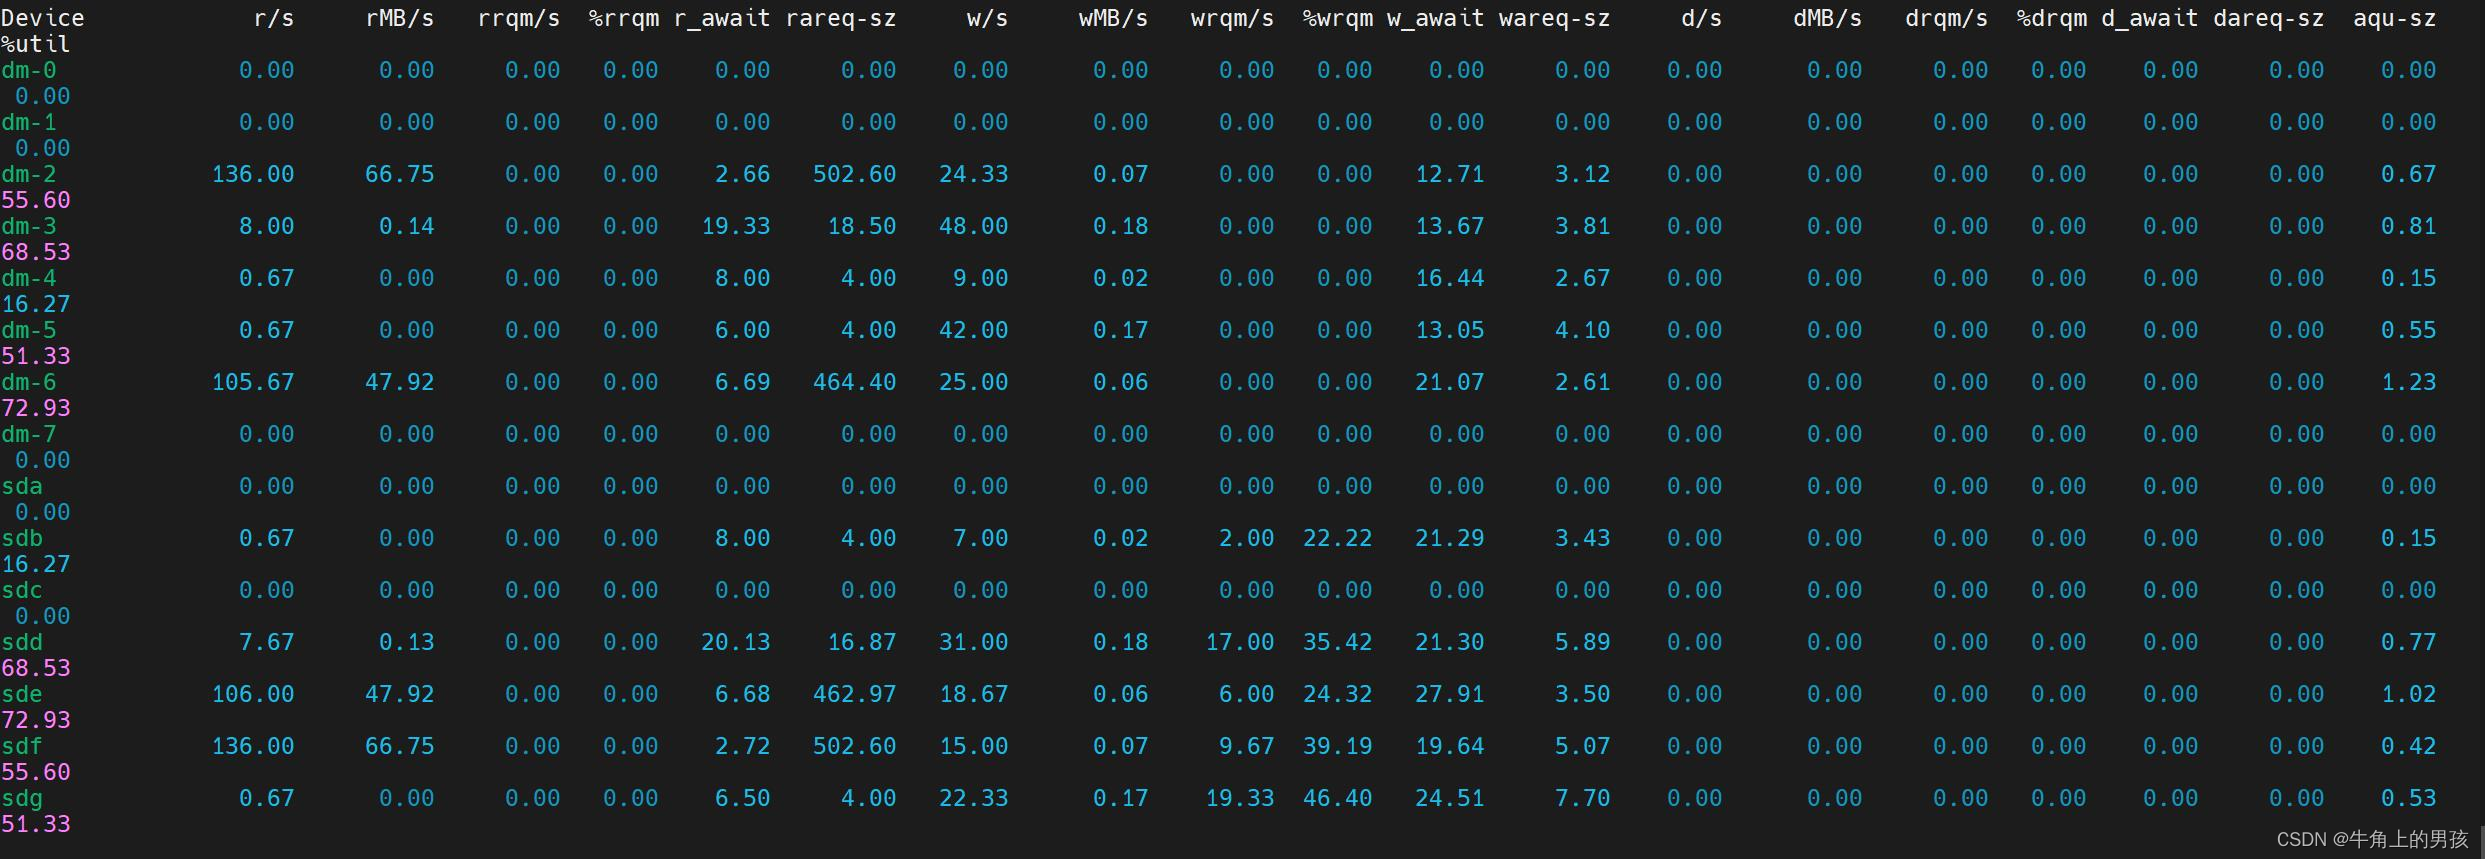 从上图看磁盘的读写繁忙程度相当高,怀疑磁盘问题,就将其中一块磁盘从集群中移出,进行fio测试,如下
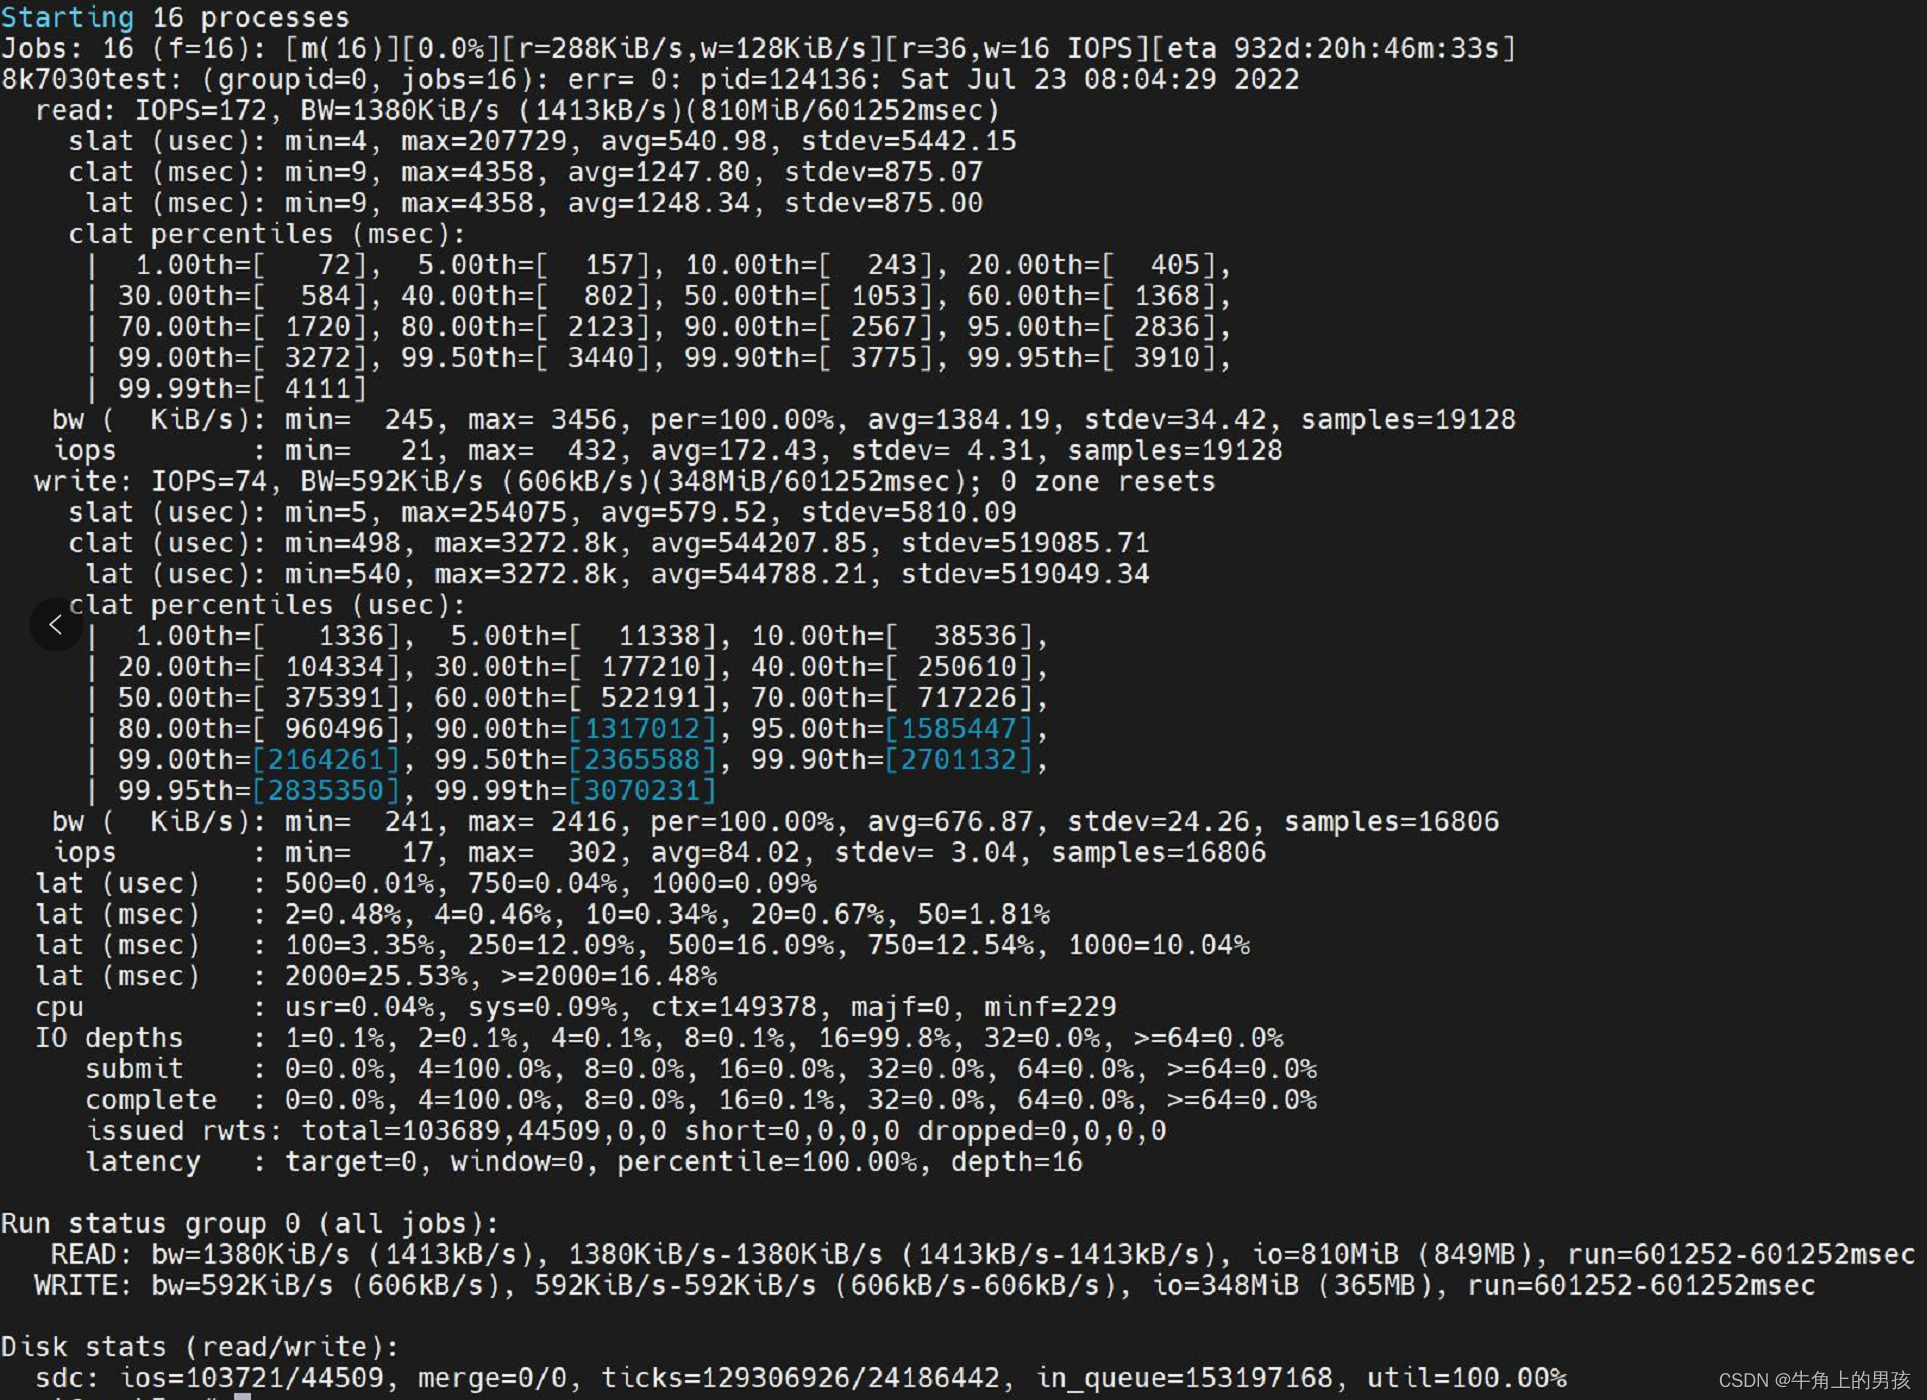
fio --filename=/dev/sde --direct=1 --rw=randrw --refill_buffers --norandommap --randrepeat=0 --ioengine=libaio --bs=8k --rwmixread=70 --iodepth=16 --numjobs=16 --runtime=600 --group_reporting --name=randrw_8k
结果如下:
 I/O延迟包括三种:slat,clat,lat
关系是 lat = slat + clat
slat 表示fio submit某个I/O的延迟。
clat 表示fio complete某个I/O的延迟。
lat 表示从fio将请求提交给内核,再到内核完成这个I/O为止所需要的时间。
从以上结果看,单磁盘本身的读写iops似乎正常,但时延却特别高,怀疑应该是磁盘的缓存及读写模式有关。
通过smartctl -x /dev/sde查看硬盘信息和Write cache状态:
smartctl 7.1 2019-12-30 r5022 [x86_64-linux-5.4.0-121-generic] (local build)
Copyright (C) 2002-19, Bruce Allen, Christian Franke, www.smartmontools.org

=== START OF INFORMATION SECTION ===
Model Family:     Toshiba MG06ACA... Enterprise Capacity HDD
Device Model:     TOSHIBA MG06ACA10TE
Serial Number:    ******
LU WWN Device Id: ******
Firmware Version: 4304
User Capacity:    10,000,831,348,736 bytes [10.0 TB]
Sector Sizes:     512 bytes logical, 4096 bytes physical
Rotation Rate:    7200 rpm
Form Factor:      3.5 inches
Device is:        In smartctl database [for details use: -P show]
ATA Version is:   ACS-3 T13/2161-D revision 5
SATA Version is:  SATA 3.3, 6.0 Gb/s (current: 6.0 Gb/s)
Local Time is:    Mon Jul 25 06:50:12 2022 UTC
SMART support is: Available - device has SMART capability.
SMART support is: Enabled
AAM feature is:   Unavailable
APM level is:     128 (minimum power consumption without standby)
Rd look-ahead is: Enabled
Write cache is:   Enabled
DSN feature is:   Unavailable
ATA Security is:  Disabled, NOT FROZEN [SEC1]
Wt Cache Reorder: Enabled

=== START OF READ SMART DATA SECTION ===
SMART overall-health self-assessment test result: PASSED

General SMART Values:
Offline data collection status:  (0x84) Offline data collection activity
                                        was suspended by an interrupting command from host.
                                        Auto Offline Data Collection: Enabled.
Self-test execution status:      (   0) The previous self-test routine completed
                                        without error or no self-test has ever
                                        been run.
Total time to complete Offline
data collection:                (  120) seconds.
Offline data collection
capabilities:                    (0x5b) SMART execute Offline immediate.
                                        Auto Offline data collection on/off support.
                                        Suspend Offline collection upon new
                                        command.
                                        Offline surface scan supported.
                                        Self-test supported.
                                        No Conveyance Self-test supported.
                                        Selective Self-test supported.
SMART capabilities:            (0x0003) Saves SMART data before entering
                                        power-saving mode.
                                        Supports SMART auto save timer.
Error logging capability:        (0x01) Error logging supported.
                                        General Purpose Logging supported.
Short self-test routine
recommended polling time:        (   2) minutes.
Extended self-test routine
recommended polling time:        (1007) minutes.
SCT capabilities:              (0x003d) SCT Status supported.
                                        SCT Error Recovery Control supported.
                                        SCT Feature Control supported.
                                        SCT Data Table supported.

SMART Attributes Data Structure revision number: 16
Vendor Specific SMART Attributes with Thresholds:
ID# ATTRIBUTE_NAME          FLAGS    VALUE WORST THRESH FAIL RAW_VALUE
  1 Raw_Read_Error_Rate     PO-R--   100   100   050    -    0
  2 Throughput_Performance  P-S---   100   100   050    -    0
  3 Spin_Up_Time            POS--K   100   100   001    -    9309
  4 Start_Stop_Count        -O--CK   100   100   000    -    22
  5 Reallocated_Sector_Ct   PO--CK   100   100   010    -    0
  7 Seek_Error_Rate         PO-R--   100   100   050    -    0
  8 Seek_Time_Performance   P-S---   100   100   050    -    0
  9 Power_On_Hours          -O--CK   093   093   000    -    3146
 10 Spin_Retry_Count        PO--CK   100   100   030    -    0
 12 Power_Cycle_Count       -O--CK   100   100   000    -    22
191 G-Sense_Error_Rate      -O--CK   100   100   000    -    0
192 Power-Off_Retract_Count -O--CK   100   100   000    -    21
193 Load_Cycle_Count        -O--CK   100   100   000    -    103
194 Temperature_Celsius     -O---K   100   100   000    -    42 (Min/Max 18/46)
196 Reallocated_Event_Count -O--CK   100   100   000    -    0
197 Current_Pending_Sector  -O--CK   100   100   000    -    0
198 Offline_Uncorrectable   ----CK   100   100   000    -    0
199 UDMA_CRC_Error_Count    -O--CK   200   200   000    -    0
220 Disk_Shift              -O----   100   100   000    -    17956871
222 Loaded_Hours            -O--CK   099   099   000    -    679
223 Load_Retry_Count        -O--CK   100   100   000    -    0
224 Load_Friction           -O---K   100   100   000    -    0
226 Load-in_Time            -OS--K   100   100   000    -    524
240 Head_Flying_Hours       P-----   100   100   001    -    0
                            ||||||_ K auto-keep
                            |||||__ C event count
                            ||||___ R error rate
                            |||____ S speed/performance
                            ||_____ O updated online
                            |______ P prefailure warning

General Purpose Log Directory Version 1
SMART           Log Directory Version 1 [multi-sector log support]
Address    Access  R/W   Size  Description
0x00       GPL,SL  R/O      1  Log Directory
0x01           SL  R/O      1  Summary SMART error log
0x02           SL  R/O     51  Comprehensive SMART error log
0x03       GPL     R/O      5  Ext. Comprehensive SMART error log
0x04       GPL,SL  R/O      8  Device Statistics log
0x06           SL  R/O      1  SMART self-test log
0x07       GPL     R/O      1  Extended self-test log
0x08       GPL     R/O      2  Power Conditions log
0x09           SL  R/W      1  Selective self-test log
0x0c       GPL     R/O    513  Pending Defects log
0x10       GPL     R/O      1  NCQ Command Error log
0x11       GPL     R/O      1  SATA Phy Event Counters log
0x24       GPL     R/O  49152  Current Device Internal Status Data log
0x25       GPL     R/O  49152  Saved Device Internal Status Data log
0x30       GPL,SL  R/O      9  IDENTIFY DEVICE data log
0x80-0x9f  GPL,SL  R/W     16  Host vendor specific log
0xe0       GPL,SL  R/W      1  SCT Command/Status
0xe1       GPL,SL  R/W      1  SCT Data Transfer

SMART Extended Comprehensive Error Log Version: 1 (5 sectors)
No Errors Logged

SMART Extended Self-test Log Version: 1 (1 sectors)
No self-tests have been logged.  [To run self-tests, use: smartctl -t]

SMART Selective self-test log data structure revision number 1
 SPAN  MIN_LBA  MAX_LBA  CURRENT_TEST_STATUS
    1        0        0  Not_testing
    2        0        0  Not_testing
    3        0        0  Not_testing
    4        0        0  Not_testing
    5        0        0  Not_testing
Selective self-test flags (0x0):
  After scanning selected spans, do NOT read-scan remainder of disk.
If Selective self-test is pending on power-up, resume after 0 minute delay.

SCT Status Version:                  3
SCT Version (vendor specific):       1 (0x0001)
Device State:                        SMART Off-line Data Collection executing in background (4)
Current Temperature:                    42 Celsius
Power Cycle Min/Max Temperature:     25/46 Celsius
Lifetime    Min/Max Temperature:     18/46 Celsius
Specified Max Operating Temperature:    55 Celsius
Under/Over Temperature Limit Count:   0/0

SCT Temperature History Version:     2
Temperature Sampling Period:         1 minute
Temperature Logging Interval:        1 minute
Min/Max recommended Temperature:      5/55 Celsius
Min/Max Temperature Limit:           -40/70 Celsius
Temperature History Size (Index):    478 (211)

Index    Estimated Time   Temperature Celsius
 212    2022-07-24 22:53    42  ***********************
 ...    ..( 63 skipped).    ..  ***********************
 276    2022-07-24 23:57    42  ***********************
 277    2022-07-24 23:58    41  **********************
 278    2022-07-24 23:59    42  ***********************
 ...    ..(397 skipped).    ..  ***********************
 198    2022-07-25 06:37    42  ***********************
 199    2022-07-25 06:38    43  ************************
 200    2022-07-25 06:39    42  ***********************
 ...    ..( 10 skipped).    ..  ***********************
 211    2022-07-25 06:50    42  ***********************

SCT Error Recovery Control:
           Read: Disabled
          Write: Disabled

Device Statistics (GP Log 0x04)
Page  Offset Size        Value Flags Description
0x01  =====  =               =  ===  == General Statistics (rev 3) ==
0x01  0x008  4              22  ---  Lifetime Power-On Resets
0x01  0x010  4            3146  ---  Power-on Hours
0x01  0x018  6      2784112966  ---  Logical Sectors Written
0x01  0x020  6        19829295  ---  Number of Write Commands
0x01  0x028  6      2635327669  ---  Logical Sectors Read
0x01  0x030  6         6882065  ---  Number of Read Commands
0x01  0x038  6     11325600000  ---  Date and Time TimeStamp
0x02  =====  =               =  ===  == Free-Fall Statistics (rev 1) ==
0x02  0x010  4               0  ---  Overlimit Shock Events
0x03  =====  =               =  ===  == Rotating Media Statistics (rev 1) ==
0x03  0x008  4             760  ---  Spindle Motor Power-on Hours
0x03  0x010  4             679  ---  Head Flying Hours
0x03  0x018  4             103  ---  Head Load Events
0x03  0x020  4               0  ---  Number of Reallocated Logical Sectors
0x03  0x028  4               0  ---  Read Recovery Attempts
0x03  0x030  4               0  ---  Number of Mechanical Start Failures
0x03  0x038  4               0  ---  Number of Realloc. Candidate Logical Sectors
0x03  0x040  4              21  ---  Number of High Priority Unload Events
0x04  =====  =               =  ===  == General Errors Statistics (rev 1) ==
0x04  0x008  4               0  ---  Number of Reported Uncorrectable Errors
0x04  0x010  4               0  ---  Resets Between Cmd Acceptance and Completion
0x05  =====  =               =  ===  == Temperature Statistics (rev 1) ==
0x05  0x008  1              42  ---  Current Temperature
0x05  0x010  1              42  N--  Average Short Term Temperature
0x05  0x018  1              35  N--  Average Long Term Temperature
0x05  0x020  1              46  ---  Highest Temperature
0x05  0x028  1              18  ---  Lowest Temperature
0x05  0x030  1              43  N--  Highest Average Short Term Temperature
0x05  0x038  1              28  N--  Lowest Average Short Term Temperature
0x05  0x040  1              35  N--  Highest Average Long Term Temperature
0x05  0x048  1              29  N--  Lowest Average Long Term Temperature
0x05  0x050  4               0  ---  Time in Over-Temperature
0x05  0x058  1              55  ---  Specified Maximum Operating Temperature
0x05  0x060  4               0  ---  Time in Under-Temperature
0x05  0x068  1               5  ---  Specified Minimum Operating Temperature
0x06  =====  =               =  ===  == Transport Statistics (rev 1) ==
0x06  0x008  4             304  ---  Number of Hardware Resets
0x06  0x010  4              79  ---  Number of ASR Events
0x06  0x018  4               0  ---  Number of Interface CRC Errors
0x07  =====  =               =  ===  == Solid State Device Statistics (rev 1) ==
                                |||_ C monitored condition met
                                ||__ D supports DSN
                                |___ N normalized value

Pending Defects log (GP Log 0x0c)
No Defects Logged

SATA Phy Event Counters (GP Log 0x11)
ID      Size     Value  Description
0x0001  4            0  Command failed due to ICRC error
0x0002  4            0  R_ERR response for data FIS
0x0003  4            0  R_ERR response for device-to-host data FIS
0x0004  4            0  R_ERR response for host-to-device data FIS
0x0005  4            0  R_ERR response for non-data FIS
0x0006  4            0  R_ERR response for device-to-host non-data FIS
0x0007  4            0  R_ERR response for host-to-device non-data FIS
0x0008  4            0  Device-to-host non-data FIS retries
0x0009  4           65  Transition from drive PhyRdy to drive PhyNRdy
0x000a  4           65  Device-to-host register FISes sent due to a COMRESET
0x000b  4            0  CRC errors within host-to-device FIS
0x000d  4            0  Non-CRC errors within host-to-device FIS
0x000f  4            0  R_ERR response for host-to-device data FIS, CRC
0x0010  4            0  R_ERR response for host-to-device data FIS, non-CRC
0x0012  4            0  R_ERR response for host-to-device non-data FIS, CRC
0x0013  4            0  R_ERR response for host-to-device non-data FIS, non-CRC
仅查看设备是否具有缓存
hdparm -W /dev/sde
smartctl -g wcache /dev/sde
查看磁盘的I/O队列调度策略:
cat /sys/block/sde/queue/scheduler
要查看设备是否具有 writeback 缓存,请读取 /sys/block/block_device /device/scsi_disk/标识符/cache_type
cat /sys/class/scsi_disk/6\:0\:1\:0/cache_type
通过关闭写缓存同时设置cache_type为write through,再次测试rados bench -p rbdbench 600 -b 4096 write --no-cleanup,发现性能提升明显,且ceph osd perf时延也下降了。
具体操作如下:
for disk in /dev/sd{a..g}; do smartctl -s wcache,off  $disk; done 或者 for disk in /dev/sd{a..g}; do hdparm -W0 $disk; done
for x in /sys/class/scsi_disk/*/cache_type; do echo 'write through' >  $x; done
ceph osd perf执行结果如下所示:

2.2 fio参数说明
fio 工具常用参数:
filename=/dev/sdb 测试设备,磁盘或者文件,磁盘将会被损坏,切记需要备份数据,文件需要后面参数指定大小。
direct=1 是否使用directIO
rw=randwrite 测试随机写的I/O
rw=randrw 测试随机写和读的I/O
bs=4k 单次io的块文件大小为4k
size=5G 每个线程读写的数据量是5GB。
numjobs=1 每个job(任务)开1个线程
runtime=600 测试时间为600秒
ioengine=libaio 指定io引擎使用libaio方式。
iodepth=16 队列的深度为16
rwmixwrite=30 在混合读写的模式下,写占30%
group_reporting 关于显示结果的,汇总每个进程的信息。

磁盘读写常用测试点:
1. Read=100% Random=100% rw=randread (100%随机读)
2. Read=100% Sequence=100% rw=read (100%顺序读)
3. Write=100% Sequence=100% rw=write (100%顺序写)
4. Write=100% Random=100% rw=randwrite (100%随机写)
5. Read=70% Sequence=100% rw=rw, rwmixread=70, rwmixwrite=30 (70%顺序读,30%顺序写)
6. Read=70% Ramdon=100% rw=randrw, rwmixread=70, rwmixwrite=30 (70%随机读,30%随机写)
2.3 rados测试说明
rados工具的语法是:rados bench -p <pool_name> <write|seq|rand> -b -t --no-cleanup
pool_name:测试所针对的存储池;
seconds:测试所持续的秒数;
<write|seq|rand>:操作模式,write:写,seq:顺序读;rand:随机读;
-b:block size,即块大小,默认为 4M;
-t:读/写并行数,默认为 16;
–no-cleanup 表示测试完成后不删除测试用数据。在做读测试之前,需要使用该参数来运行一遍写测试来产生测试数据,在全部测试结束后可以运行 rados -p <pool_name> cleanup 来清理所有测试数据。
2.4 iostat参数说明
iostat的用法(每3秒钟采集一组数据)如下:
iostat -mtx 3
常用参数意义:
-m     Display statistics in megabytes per second.
-t     Print the time for each report displayed. The timestamp format may depend on the value of the S_TIME_FORMAT environment variable (see below).
-x     Display extended statistics.
输出信息常用的含义:
rrqm/s : 每秒合并读操作的次数
wrqm/s: 每秒合并写操作的次数
r/s :每秒读操作的次数
w/s : 每秒写操作的次数
rMB/s :每秒读取的MB字节数
wMB/s: 每秒写入的MB字节数
r_await:每个读操作平均所需要的时间,不仅包括硬盘设备读操作的时间,也包括在内核队列中的时间。
w_await: 每个写操平均所需要的时间,不仅包括硬盘设备写操作的时间,也包括在队列中等待的时间。
%util: 工作时间或者繁忙时间占总时间的百分比
2.5 osd id与磁盘对应关系
ceph采用bluestore存储后端后,df命令不能直接显示osd id与磁盘/dev/sdx的对应关系,如下:
# df
Filesystem                         Size  Used Avail Use% Mounted on
udev                               126G     0  126G   0% /dev
tmpfs                               26G  2.3M   26G   1% /run
/dev/mapper/ubuntu--vg-ubuntu--lv  268G   14G  241G   6% /
tmpfs                              126G     0  126G   0% /dev/shm
tmpfs                              5.0M     0  5.0M   0% /run/lock
tmpfs                              126G     0  126G   0% /sys/fs/cgroup
/dev/mapper/ubuntu--vg-lv--0       3.9G  222M  3.5G   6% /boot
/dev/sda1                          511M  5.3M  506M   2% /boot/efi
tmpfs                              126G   52K  126G   1% /var/lib/ceph/osd/ceph-19
tmpfs                              126G   52K  126G   1% /var/lib/ceph/osd/ceph-21
tmpfs                              126G   52K  126G   1% /var/lib/ceph/osd/ceph-23
tmpfs                              126G   52K  126G   1% /var/lib/ceph/osd/ceph-25
tmpfs                              126G   52K  126G   1% /var/lib/ceph/osd/ceph-28
tmpfs                              126G   52K  126G   1% /var/lib/ceph/osd/ceph-29
tmpfs                               26G     0   26G   0% /run/user/0
以前的/dev/sdx被tmpfs取代,如果某个osd故障怎么知道它对应哪块磁盘呢?
其实OSD磁盘对应的设备就链接在osd挂载目录下面的block,如:
# ls -l /var/lib/ceph/osd/ceph-28
total 52
-rw-r--r-- 1 ceph ceph 415 Jul  6 16:17 activate.monmap
lrwxrwxrwx 1 ceph ceph  93 Jul  6 16:17 block -> /dev/ceph-a1b52f32-f0d5-427d-88d3-732b01d82c4e/osd-block-51399447-b959-4759-ba99-c7180a9d74e2
-rw------- 1 ceph ceph   2 Jul  6 16:17 bluefs
-rw------- 1 ceph ceph  37 Jul  6 16:17 ceph_fsid
-rw-r--r-- 1 ceph ceph  37 Jul  6 16:17 fsid
-rw------- 1 ceph ceph  56 Jul  6 16:17 keyring
-rw------- 1 ceph ceph   8 Jul  6 16:17 kv_backend
-rw------- 1 ceph ceph  21 Jul  6 16:17 magic
-rw------- 1 ceph ceph   4 Jul  6 16:17 mkfs_done
-rw------- 1 ceph ceph  41 Jul  6 16:17 osd_key
-rw------- 1 ceph ceph   6 Jul  6 16:17 ready
-rw------- 1 ceph ceph   3 Jul  6 16:17 require_osd_release
-rw------- 1 ceph ceph  10 Jul  6 16:17 type
-rw------- 1 ceph ceph   3 Jul  6 16:17 whoami
这个"block"就是对应的OSD设备,那怎么把后面那一串让人眼花缭乱的uuid还原为熟悉的/dev/sdx呢,使用命令"dmsetup",如:
# dmsetup table /dev/ceph-a1b52f32-f0d5-427d-88d3-732b01d82c4e/osd-block-51399447-b959-4759-ba99-c7180a9d74e2
0 19532865536 linear 8:64 2048
注意这个编号"8:64",对比一下
# ls -hl /dev/sd*
brw-rw---- 1 root disk 8,  0 Jul  6 15:51 /dev/sda
brw-rw---- 1 root disk 8,  1 Jul  6 15:51 /dev/sda1
brw-rw---- 1 root disk 8,  2 Jul  6 15:51 /dev/sda2
brw-rw---- 1 root disk 8,  3 Jul  6 15:51 /dev/sda3
brw-rw---- 1 root disk 8, 16 Jul  6 16:17 /dev/sdb
brw-rw---- 1 root disk 8, 32 Jul 23 10:31 /dev/sdc
brw-rw---- 1 root disk 8, 48 Jul  6 16:16 /dev/sdd
brw-rw---- 1 root disk 8, 64 Jul  6 16:17 /dev/sde
brw-rw---- 1 root disk 8, 80 Jul  6 16:16 /dev/sdf
brw-rw---- 1 root disk 8, 96 Jul  6 16:17 /dev/sdg
我们就知道了osd 28对应的磁盘是 /dev/sde
2.6 常见存储设备参考性能,8~16K
5400 rpm SATA,60 IOPS
7200 rpm SATA,70 IOPS
10000 rpm SAS,110 IOPS
15000 rpm SAS,150 IOPS,Sequential RW 180MB/s、Radom RW 15MB/s。
10000 rpm FC,125 IOPS
15000 rpm FC,150 IOPS
SSD Sata,3000~40000 IOPS,R 400MB/s、W 250MB/s。
SSD PCIE,20000~40000 IOPS,R 500MB/s、W 300MB/s。
内存,1000000+ IOPS,30~60 GB/s。
3. 解决方案
关闭磁盘的写缓存,设置Volatile Cache为write through,批量配置如下所示:
for disk in /dev/sd{a..g}; do smartctl -s wcache,off  $disk; done 或者 for disk in /dev/sd{a..g}; do hdparm -W0 $disk; done
for x in /sys/class/scsi_disk/*/cache_type; do echo 'write through' >  $x; done
4. 参考方案
https://cloud.tencent.com/developer/article/2007997
https://cloud.tencent.com/developer/article/1159044
https://bean-li.github.io/dive-into-iostat/
http://linuxperf.com/?p=156
https://www.liujason.com/article/1120.html
https://access.redhat.com/documentation/en-us/red_hat_ceph_storage/3/html/administration_guide/performance_counters
https://access.redhat.com/documentation/en-us/red_hat_ceph_storage/5/html/configuration_guide/ceph-network-configuration#:~:text=Ceph%20assumes%20a%20public%20network%20with%20all%20hosts,improve%20performance%2C%20compared%20to%20using%20a%20single%20network.
https://tracker.ceph.com/issues/38738
lists.ceph.com/pipermail/ceph-users-ceph.com/2019-February/033119.html
https://blog.csdn.net/don_chiang709/article/details/92628623
https://yourcmc.ru/wiki/index.php?title=Ceph_performance&mobileaction=toggle_view_desktop#Drive_cache_is_slowing_you_down
https://support.huaweicloud.com/tngg-kunpenghpcs/kunpenghpcsolution_05_0019.html
https://huataihuang.gitbooks.io/cloud-atlas/content/os/linux/storage/disk/ssd_hdd_mix_io_scheduler.html


 304
304


 被折叠的 条评论
为什么被折叠?
被折叠的 条评论
为什么被折叠?
 到【灌水乐园】发言


