


 本文展示了如何在使用matplotlib进行Python绘图时插入希腊字母,例如通过r"$alpha$=0.8"的语法来表示α等于0.8。
如题所述,以下分享一个用python的matplotlib包画图的时候在图中插入希腊字母的例子,简单说就是用r"$\alpha$=0.8"这样的形式,注意最开始的字母r不能丢。
import json
import matplotlib.pyplot as plt
import matplotlib
#import np
from matplotlib.patches import Ellipse
font = {'size':18}
matplotlib.rc('font', **font)
src1 = "./cdf.caida.20180315-125910.json"
src2 = "./cdf.caida.20180315-130000.json"
src3 = "./cdf.hgc.20080415000.json"
src4 = "./cdf.hgc.20080415001.json"
src5 = "./zipf_dist_1.json"
src6 = "./zipf_dist_2.json"
if __name__ == "__main__":
with open(src1, "r") as f:
[idx1, cdf1] = json.load(f)
with open(src2, "r") as f:
[idx2, cdf2] = json.load(f)
with open(src3, "r") as f:
[idx3, cdf3] = json.load(f)
with open(src4, "r") as f:
[idx4, cdf4] = json.load(f)
with open(src5, "r") as f:
[idx5, cdf5] = json.load(f)
with open(src6, "r") as f:
[idx6, cdf6] = json.load(f)
plt.figure(1)
# plt.title("Heavy Hitters ARE")
# plt.xticks(range(5), ("1M", "5M", "10M", "15M", "20M"))
plt.ylim(0, 1.05)
plt.plot(idx1, cdf1, label = "CAIDA1", marker = "x", mfc="none")
plt.plot(idx2, cdf2, label = "CAIDA2", marker = "s", mfc="none")
plt.plot(idx3, cdf3, label = "ISP1", marker = "o", mfc="none")
plt.plot(idx4, cdf4, label = "ISP2", marker = "1", mfc="none")
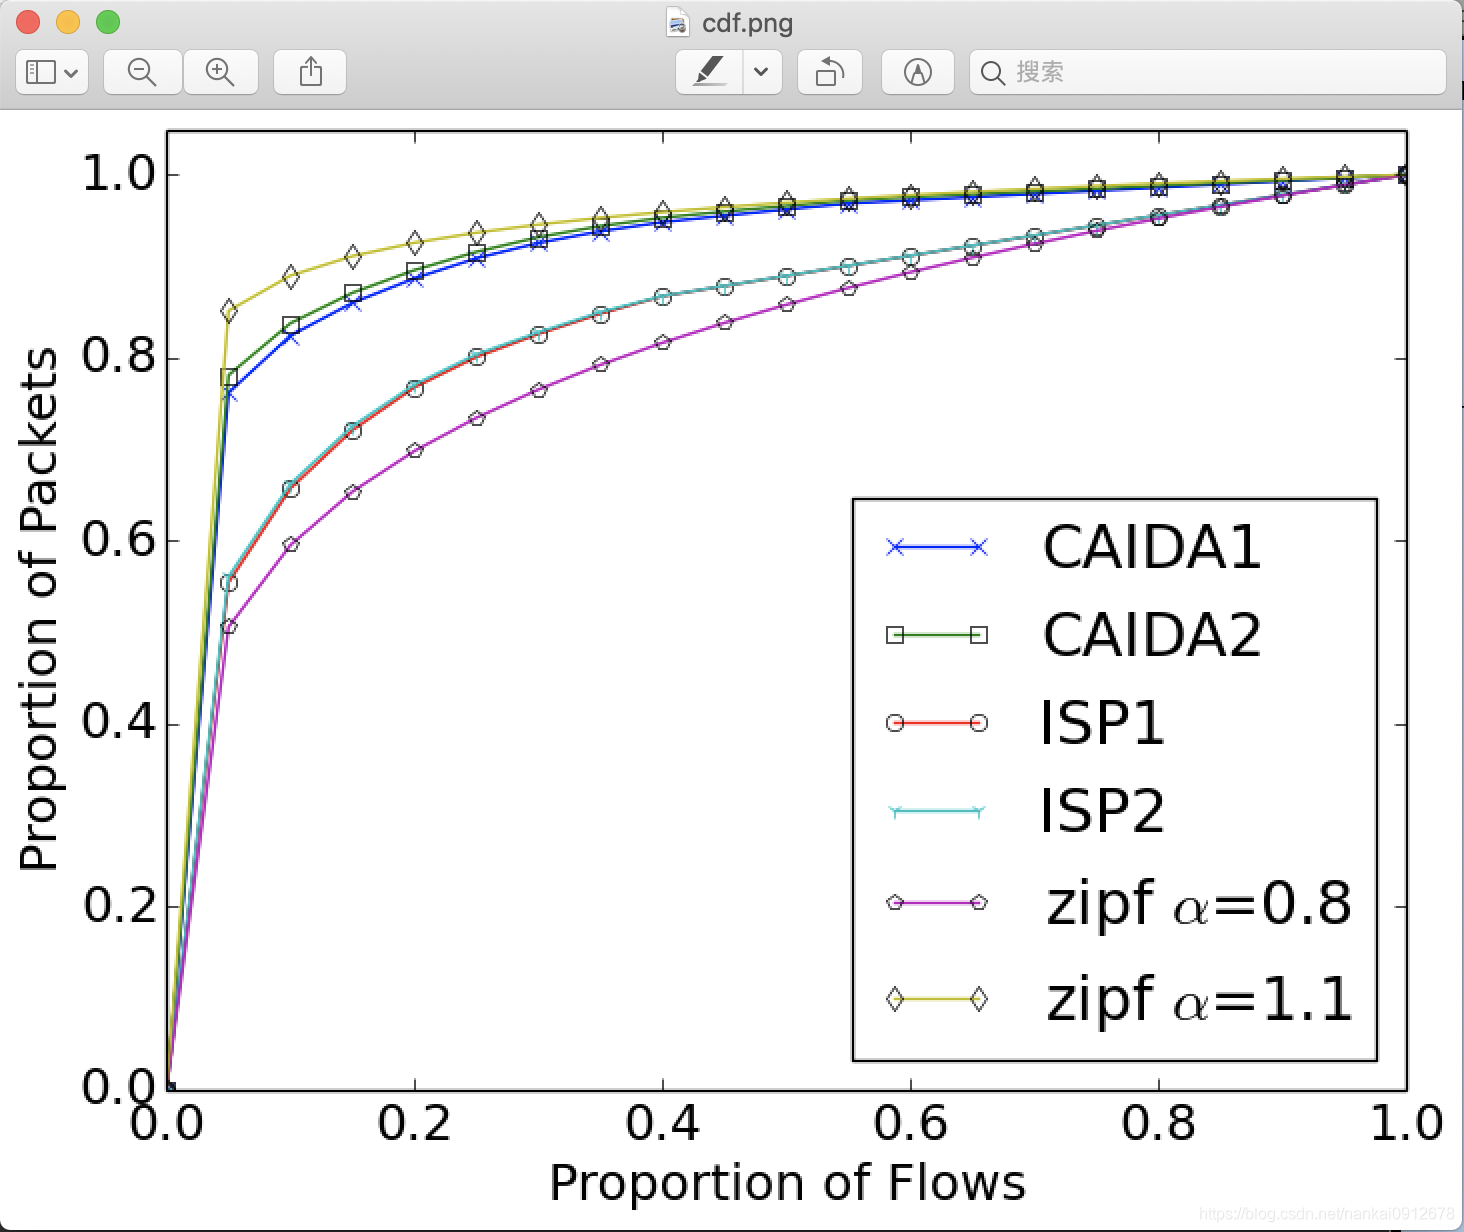
plt.plot(idx5, cdf5, label = r"zipf $\alpha$=0.8", marker = "p", mfc="none")
plt.plot(idx6, cdf6, label = r"zipf $\alpha$=1.1", marker = "d", mfc="none")
# plt.plot(range(5), are_hw, label = "Hardware", marker = "o")
# plt.legend(bbox_to_anchor=(0.0, 1.02, 1.0, 0.102), loc = 3, ncol = 2, mode = "expand", borderaxespad = 0.0)
plt.legend(loc = 4)
plt.xlabel("Proportion of Flows")
plt.ylabel("Proportion of Packets")
plt.savefig("cdf.pdf", bbox_inches = "tight")
plt.savefig("cdf.png", bbox_inches = "tight")其运行结果如下:


 2478
2478

 被折叠的 条评论
为什么被折叠?
被折叠的 条评论
为什么被折叠?
 到【灌水乐园】发言


