1.新建一个qt新工程,往主界面中拖动一个QwtPlot控件,保存后关闭。
ps:如果在设计界面没有,试试qt界面用qt designer打开试试
2.下面开始QwtPlot的简单使用
a)控件的位置移动和大小设置
int width = this->width()-10;
int height = this->height() - 50;
ui->qwtPlot->move(0,0);
ui->qwtPlot->resize(width,height);
可以自己调整下move参数看看效果。
b)设置标题有两种形式
1)参数为QString
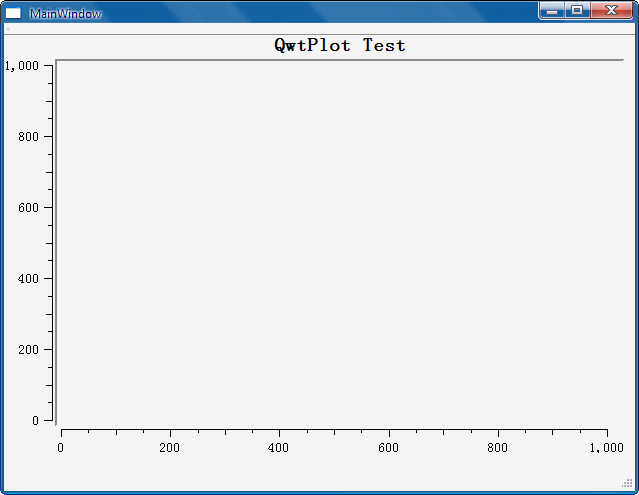
ui->qwtPlot->setTitle(QObject::trUtf8("QwtPlot Test"));
效果如下:
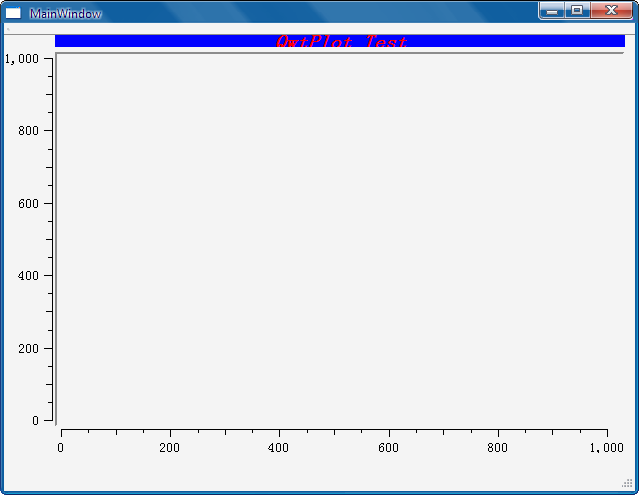
2)参数为QwtText,此种类型为我们提供了包括字体,颜色等设置
QwtText t;
t.setText(QObject::trUtf8("QwtPlot Test"));
QFont font;
font.setBold(true);
font.setItalic(true);
t.setFont(font);
t.setColor(QColor(255,0,0));
QBrush brush(QColor(0,0,255));
t.setBackgroundBrush(brush);
ui->qwtPlot->setTitle(t);
- 1
- 2
- 3
- 4
- 5
- 6
- 7
- 8
- 9
- 10
- 11
- 12
- 13
- 14
- 15
- 16
- 17
运行效果如下
c)坐标轴控制
QwtPlot为我们提供了4条坐标轴,分别是底部坐标轴,左坐标轴,顶部坐标轴,右坐标轴
左坐标轴 QwtPlot::yLeft
右坐标轴 QwtPlot::yRight
底部坐标轴 QwtPlot::xBottom
顶部坐标轴 QwtPlot::xTop
我们可以先来看看代码实现
ui->qwtPlot->setAxisScale(QwtPlot::yLeft,0,100,10);
ui->qwtPlot->setAxisScale(QwtPlot::xBottom,0,100,10);
ui->qwtPlot->setAxisScale(QwtPlot::yRight,0,100,10);
ui->qwtPlot->setAxisScale(QwtPlot::xTop,0,100,10);
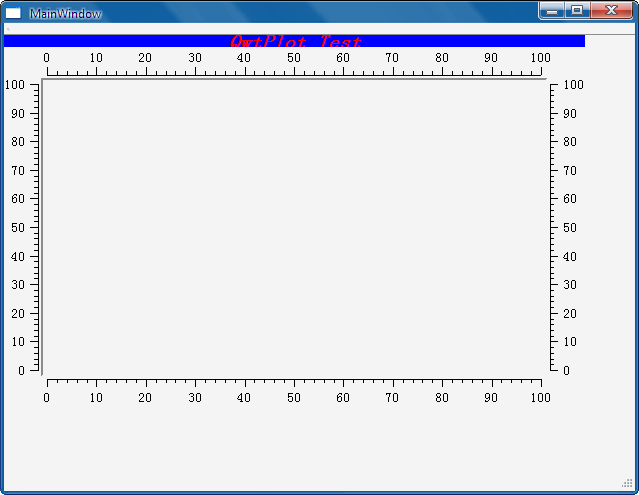
运行下看看效果:
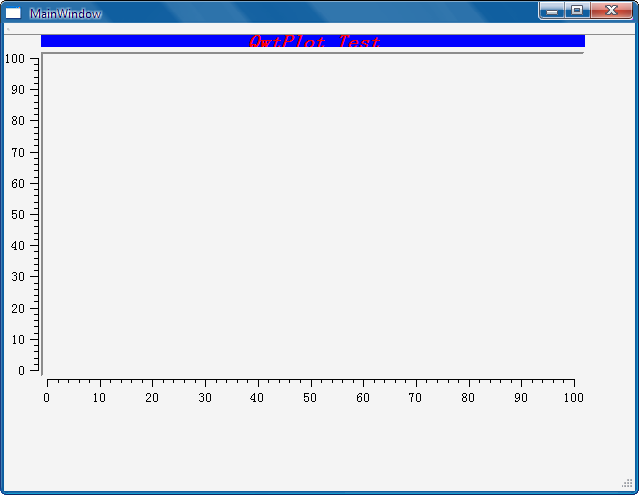
奇怪,为什么我们设置了右坐标轴和顶部坐标轴,为什么不显示呢?
我们在代码中加入如下语句看看输出结果
qDebug()<<ui->qwtPlot->axisEnabled(QwtPlot::yLeft);
qDebug()<<ui->qwtPlot->axisEnabled(QwtPlot::xBottom);
qDebug()<<ui->qwtPlot->axisEnabled(QwtPlot::yRight);
qDebug()<<ui->qwtPlot->axisEnabled(QwtPlot::xTop);
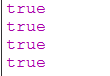
控制台输出结果如下:
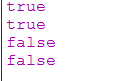
从结果我们可知,原来右坐标轴和顶部坐标轴处于不可用状态,所以没有显示。
那么就很容易了,只要让顶部坐标轴和右坐标轴enable即可,我们在qDebug之前加入如下两句
    ui->qwtPlot->enableAxis(QwtPlot::yRight,true);
    ui->qwtPlot->enableAxis(QwtPlot::xTop,true);
再来看看运行效果和控制台输出结果:
可见,四条坐标轴都显示出来了,QwtPlot默认enable的坐标轴是左坐标轴和底部坐标轴。
我们可以给每条坐标轴设置一个title,赋予具体含义:
    ui->qwtPlot->setAxisTitle(QwtPlot::yLeft,QObject::trUtf8("Left"));
    ui->qwtPlot->setAxisTitle(QwtPlot::yRight,QObject::trUtf8("Right"));
    ui->qwtPlot->setAxisTitle(QwtPlot::xBottom,QObject::trUtf8("Bottom"));
    ui->qwtPlot->setAxisTitle(QwtPlot::xTop,QObject::trUtf8("Top"));
运行效果如下:
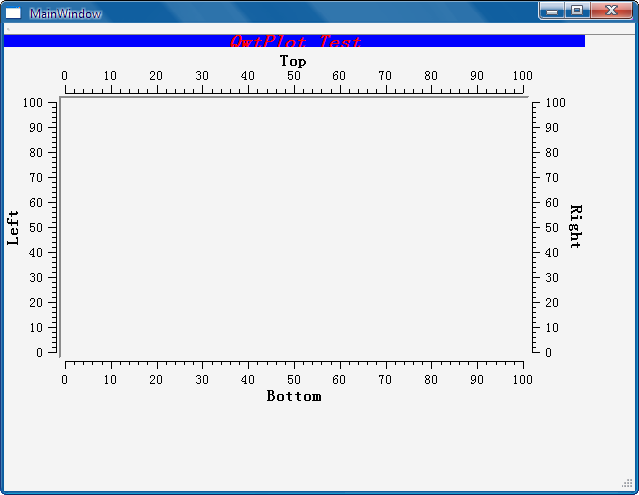
这里的setAxisTitle设置坐标轴标题函数的第二个参数也可以是QwtText类型。
我们也可以更改坐标轴坐标值的字体
QFont f("宋体", 12);
ui->qwtPlot->setAxisFont(QwtPlot::xBottom,f);
d)画图:终于到往QwtPlot控件内画曲线了。
步骤:
1.创建plot组件
2.往plot组件加入数据
3.把plot组件附加到qwtPlot中
QVector<QPointF> vector;
for(int i =0;i<100;i++){
QPointF point;
point.setX(i);
int y = 20*sin(i*M_PI/10) + 50;
point.setY(y);
vector.append(point);
}
QwtPointSeriesData* series = new QwtPointSeriesData(vector);
QwtPlotCurve* curve1 = new QwtPlotCurve("Curve 1");
curve1->setData(series);
curve1->attach(ui->qwtPlot);
ui->qwtPlot->replot();
ui->qwtPlot->show();
- 1
- 2
- 3
- 4
- 5
- 6
- 7
- 8
- 9
- 10
- 11
- 12
- 13
- 14
- 15
- 16
- 17
- 18
- 19
- 20
- 21
其中的QwtPlotCurve即为plot组件,由此可知我们可以往qwtPlot中加入多个组件。
其中QwtPlotCurve的组件有:
| QwtPlotCurve | 曲线 |
| QwtPlotMarker | 标记 |
| QwtPlotGrid | 网格 |
| QwtPlotHistogram | 直方图 |
| other | 从QwtPlotItem继承的组件 |
e)我们下面来试试两个曲线组件
把之前的拷贝复制修改下:
QVector<QPointF> vector2;
for(int i =0;i<100;i++){
QPointF point;
point.setX(i);
int y = 10*sin(i*M_PI/10) + 20;
point.setY(y);
vector2.append(point);
}
QwtPointSeriesData* series2 = new QwtPointSeriesData(vector2);
QwtPlotCurve* curve2 = new QwtPlotCurve("Curve 2");
curve2->setData(series2);
curve2->attach(ui->qwtPlot);
- 1
- 2
- 3
- 4
- 5
- 6
- 7
- 8
- 9
- 10
- 11
- 12
- 13
- 14
- 15
- 16
- 17
这时我们看看结果:
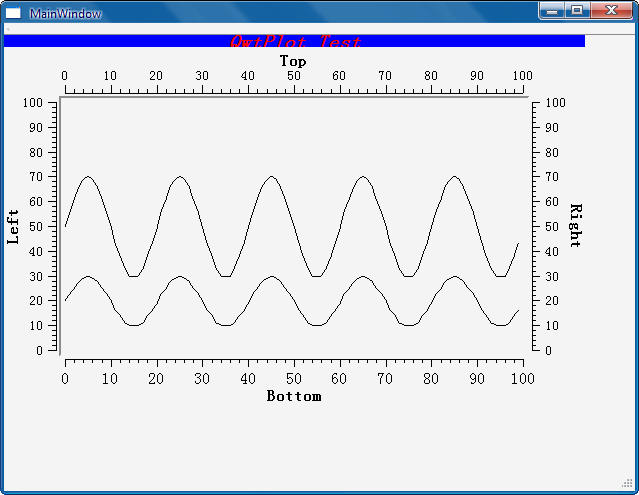
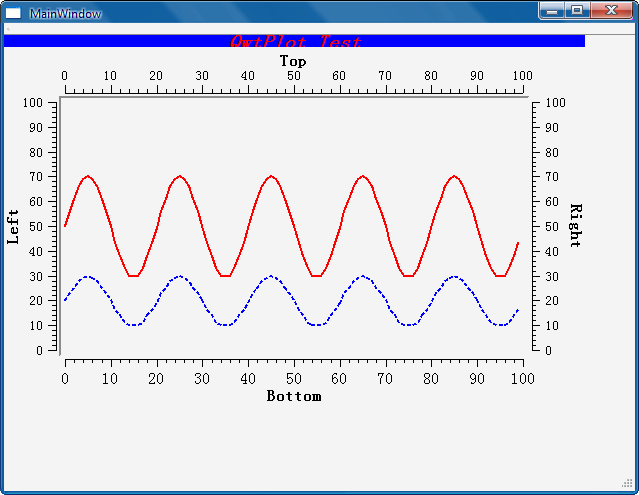
f)然后我们试试给曲线设置画笔,在将curve附加到qwtPlot之前分别为curve1和curve2加入如下两句:
curve1->setPen(QColor(255,0,0),2,Qt::SolidLine);
......
curve2->setPen(QColor(0,0,255),2,Qt::DotLine);
再来看看效果图:
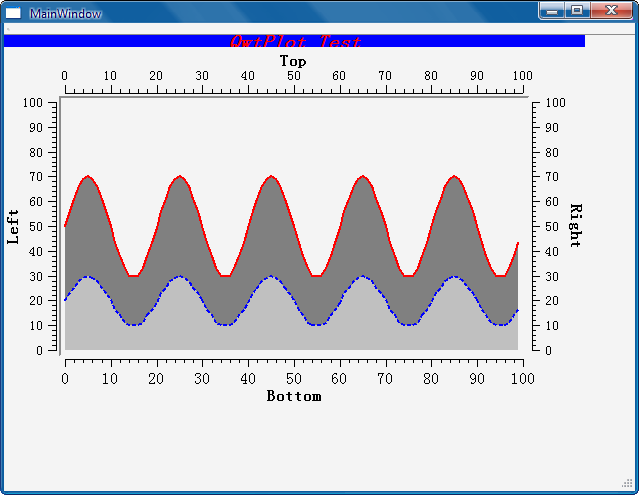
g)设置填充画刷,还是在附加到qwtPlot之前加入以下语句
QBrush brush2(QColor(128,128,128));
curve1->setBrush(brush2);
......
QBrush brush3(QColor(192,192,192));
curve2->setBrush(brush3);
看看效果图
h)加入网格,在代码最后添加如下:
QwtPlotGrid* grid = new QwtPlotGrid();
grid->setPen(QColor(222,222,222),1);
grid->attach(ui->qwtPlot);
效果如图:

i)最后介绍下如何删除所画的图形,很简单
curve1->detach();
curve2->detach();
也就是把相关组件取消关联即可。
好了关于QwtPlot的简单使用就介绍到这了,关于QwtPlot的更多功能请参看文档实现。
本实例的所有源码附加如下:
main.cpp
#include "mainwindow.h"
#include <QApplication>

int main(int argc, char *argv[])
{
    QApplication a(argc, argv);
    MainWindow w;
    w.show();

    return a.exec();
}
mainwindow.h
#ifndef MAINWINDOW_H
#define MAINWINDOW_H

#include <QMainWindow>

namespace Ui {
class MainWindow;
}

class MainWindow : public QMainWindow
{
    Q_OBJECT

public:
    explicit MainWindow(QWidget *parent = 0);
    ~MainWindow();

public:
    void qwtPlotTest();
private:
    Ui::MainWindow *ui;
};

#endif // MAINWINDOW_H
- 1
- 2
- 3
- 4
- 5
- 6
- 7
- 8
- 9
- 10
- 11
- 12
- 13
- 14
- 15
- 16
- 17
- 18
- 19
- 20
- 21
- 22
- 23
- 24
- 25
mainwindow.cpp
#include "mainwindow.h"
#include "ui_mainwindow.h"
#include <QDebug>
#include <qwt_plot.h>
#include <qwt_plot_curve.h>
#include <qwt_plot_grid.h>
MainWindow::MainWindow(QWidget *parent) :
QMainWindow(parent),
ui(new Ui::MainWindow)
{
ui->setupUi(this);
qwtPlotTest();
}
MainWindow::~MainWindow()
{
delete ui;
}
void MainWindow::qwtPlotTest()
{
int width = this->width()- 50;
int height = this->height() - 100;
ui->qwtPlot->move(0,0);
ui->qwtPlot->resize(width,height);
QwtText t;
t.setText(QObject::trUtf8("QwtPlot Test"));
QFont font;
font.setBold(true);
font.setItalic(true);
t.setFont(font);
t.setColor(QColor(255,0,0));
QBrush brush(QColor(0,0,255));
t.setBackgroundBrush(brush);
ui->qwtPlot->setTitle(t);
ui->qwtPlot->enableAxis(QwtPlot::yRight,true);
ui->qwtPlot->enableAxis(QwtPlot::xTop,true);
qDebug()<<ui->qwtPlot->axisEnabled(QwtPlot::yLeft);
qDebug()<<ui->qwtPlot->axisEnabled(QwtPlot::xBottom);
qDebug()<<ui->qwtPlot->axisEnabled(QwtPlot::yRight);
qDebug()<<ui->qwtPlot->axisEnabled(QwtPlot::xTop);
ui->qwtPlot->setAxisScale(QwtPlot::yLeft,0,100,10);
ui->qwtPlot->setAxisScale(QwtPlot::xBottom,0,100,10);
ui->qwtPlot->setAxisScale(QwtPlot::yRight,0,100,10);
ui->qwtPlot->setAxisScale(QwtPlot::xTop,0,100,10);
ui->qwtPlot->setAxisTitle(QwtPlot::yLeft,QObject::trUtf8("Left"));
ui->qwtPlot->setAxisTitle(QwtPlot::yRight,QObject::trUtf8("Right"));
ui->qwtPlot->setAxisTitle(QwtPlot::xBottom,QObject::trUtf8("Bottom"));
ui->qwtPlot->setAxisTitle(QwtPlot::xTop,QObject::trUtf8("Top"));
QFont f("宋体", 12);
ui->qwtPlot->setAxisFont(QwtPlot::xBottom,f);
QVector<QPointF> vector;
for(int i =0;i<100;i++){
QPointF point;
point.setX(i);
int y = 20*sin(i*M_PI/10) + 50;
point.setY(y);
vector.append(point);
}
QwtPointSeriesData* series = new QwtPointSeriesData(vector);
QwtPlotCurve* curve1 = new QwtPlotCurve("Curve 1");
curve1->setData(series);
curve1->setPen(QColor(255,0,0),2,Qt::SolidLine);
QBrush brush2(QColor(128,128,128));
curve1->setBrush(brush2);
curve1->setCurveAttribute(QwtPlotCurve::Fitted, true);
curve1->attach(ui->qwtPlot);
QVector<QPointF> vector2;
for(int i =0;i<100;i++){
QPointF point;
point.setX(i);
int y = 10*sin(i*M_PI/10) + 20;
point.setY(y);
vector2.append(point);
}
QwtPointSeriesData* series2 = new QwtPointSeriesData(vector2);
QwtPlotCurve* curve2 = new QwtPlotCurve("Curve 2");
curve2->setData(series2);
curve2->setPen(QColor(0,0,255),2,Qt::DotLine);
QBrush brush3(QColor(192,192,192));
curve2->setBrush(brush3);
curve2->attach(ui->qwtPlot);
QwtPlotGrid* grid = new QwtPlotGrid();
grid->setPen(QColor(222,222,222),1);
grid->attach(ui->qwtPlot);
ui->qwtPlot->replot();
ui->qwtPlot->show();
}


 1万+
1万+

 被折叠的 条评论
为什么被折叠?
被折叠的 条评论
为什么被折叠?
 到【灌水乐园】发言


