


1.mayavi介绍
Mayavi2完全用Python编写,因此它不但是一个方便实用的可视化软件,而且可以方便地用Python编写扩展,嵌入到用户编写的Python程序中,或者直接使用其面向脚本的API:mlab快速绘制三维图。
mayavi介绍链接:
http://code.enthought.com/projects/mayavi/
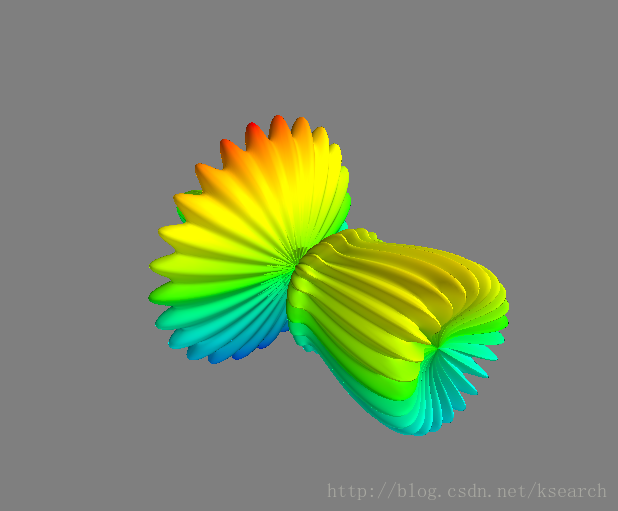
2.作图代码
from numpy import pi, sin, cos, mgrid
dphi, dtheta = pi/250.0, pi/250.0
[phi,theta] = mgrid[0:pi+dphi*1.5:dphi,0:2*pi+dtheta*1.5:dtheta]
m0 = 4; m1 = 3; m2 = 2; m3 = 3; m4 = 6; m5 = 2; m6 = 6; m7 = 4;
r = sin(m0*phi)**m1 + cos(m2*phi)**m3 + sin(m4*theta)**m5 + cos(m6*theta)**m7
x = r*sin(phi)*cos(theta)
y = r*cos(phi)
z = r*sin(phi)*sin(theta)
# View it.
from enthought.mayavi import mlab
s = mlab.mesh(x, y, z)
mlab.show()
3.中间遇到的几个问题
3.1 No module named pkg_resources
3.2 configobj 模块找不到
3.3 需要安装wxPyhon or PyQt
这里我安装的是wxPython
wxPython是Python语言的一套优秀的GUI图形库,允许Python程序员很方便的创建完整的、功能键全的GUI用户界面。 wxPython是作为优秀的跨平台GUI库wxWidgets的Python封装和Python模块的方式提供给用户的。
4.效果


 520
520

 被折叠的 条评论
为什么被折叠?
被折叠的 条评论
为什么被折叠?
 到【灌水乐园】发言


