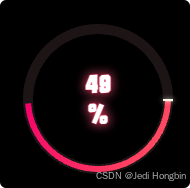
echarts自定义图表--仪表盘

在这里插入图片描述
基于仪表盘类型的自定义表盘
在这里插入图片描述

上图为3层结构组成

  • 正常一个仪表盘配置
  • 要在外圈和内圈之间制造一条缝隙间隔 再创建一个仪表盘配置 背景透明 进度条拉满 进度条颜色和数据的背景相同
  • 开始处的线 又一个仪表盘配置 数值固定一个比较小的值
<!DOCTYPE html>
<html>
    <head>
        <meta charset="utf-8" />
        <script src="https://cdn.jsdelivr.net/npm/echarts@5"></script>
        <style>
            #main {
                width: 200px;
                height: 200px;
                margin: 100px auto;
            }
        </style>
        <style>
            /* 在 CSS 文件中定义自定义字体 */
            @font-face {
                font-family: "MyCustomFont"; /* 自定义字体名称 */
                src: url("public/只含数字.ttf");
                font-weight: normal;
                font-style: normal;
            }
        </style>
    </head>
    <body>
        <div id="main"></div>
        <script>
            var chart = echarts.init(document.getElementById("main"));

            const bgColor = "#1F1316";

            chart.setOption({
                backgroundColor: "black",
                series: [
                    {
                        type: "gauge",
                        startAngle: 0,
                        endAngle: 360,
                        itemStyle: {
                            // shadowColor: "#fff",
                            // shadowBlur: 10,
                        },
                        progress: {
                            show: true,
                            width: 8,
                            // roundCap: true,
                            overlap: true,
                            itemStyle: {
                                // borderColor: "#fff",
                                // borderWidth: 1,
                                // opacity: 1,
                                // borderType: [5, 10],
                                // borderDashOffset: 5,
                                color: {
                                    type: "linear",
                                    x: 0,
                                    y: 0,
                                    x2: 1,
                                    y2: 1,
                                    colorStops: [
                                        { offset: 0, color: "#f20075" }, // 渐变起始色
                                        { offset: 1, color: "#ff6666" }, // 渐变结束色
                                    ],
                                },
                                // shadowColor: "#f20075",
                                // shadowBlur: 10,
                            },
                        },
                        axisLine: {
                            lineStyle: {
                                width: 10,
                                // color: [[1, "#1F1016"]], // 背景圆环
                                color: [[1, bgColor]], // 背景圆环
                            },
                        },
                        pointer: {
                            show: false,
                        },
                        axisTick: {
                            show: false,
                        },
                        splitLine: {
                            show: false,
                        },
                        axisLabel: {
                            show: false,
                        },
                        detail: {
                            valueAnimation: true,
                            formatter: "{value}\n%",
                            fontSize: 24,
                            fontFamily: "MyCustomFont",
                            color: "#fff",
                            textShadowColor: "#CB3359",
                            textShadowBlur: 10,
                            textBorderColor: "#CB3359",
                            textBorderWidth: 1,
                            offsetCenter: [0, "0%"],
                        },
                        data: [
                            {
                                value: 49,
                            },
                        ],
                        z: 1,
                    },
                    // 紧贴外圈与背景同色 利用遮蔽下层颜色产生间隔效果
                    {
                        type: "gauge",
                        startAngle: 0,
                        endAngle: 360,
                        itemStyle: {
                            color: "",
                        },
                        progress: {
                            show: true,
                            width: 2,
                            itemStyle: {
                                color: bgColor,
                            },
                        },
                        pointer: {
                            show: false,
                        },
                        axisLine: {
                            show: false,
                        },
                        axisTick: {
                            show: false,
                        },
                        splitLine: {
                            show: false,
                        },
                        axisLabel: {
                            show: false,
                        },
                        detail: {
                            show: false,
                        },
                        data: [
                            {
                                value: 100,
                            },
                        ],
                        z: 2,
                    },
                    // 开始处齐点
                    {
                        type: "gauge",
                        startAngle: 0,
                        endAngle: 360,
                        itemStyle: {
                            color: "",
                        },
                        progress: {
                            show: true,
                            width: 10,
                            itemStyle: {
                                // borderColor: "#fffae5",
                                // borderWidth: 1,
                                // borderType: [5, 10],
                                // borderDashOffset: 5,
                                color: "#fffae5",
                                shadowColor: "#fff",
                                shadowBlur: 5,
                            },
                        },
                        pointer: {
                            show: false,
                        },
                        axisLine: {
                            show: false,
                        },
                        axisTick: {
                            show: false,
                        },
                        splitLine: {
                            show: false,
                        },
                        axisLabel: {
                            show: false,
                        },
                        detail: {
                            show: false,
                        },
                        data: [
                            {
                                value: 0.5,
                            },
                        ],
                        z: 3,
                    },
                ],
            });
        </script>
    </body>
</html>

评论
添加红包

请填写红包祝福语或标题

红包个数最小为10个

红包金额最低5元

当前余额3.43前往充值 >
需支付:10.00
成就一亿技术人!
领取后你会自动成为博主和红包主的粉丝 规则
hope_wisdom
发出的红包
实付
使用余额支付
点击重新获取
扫码支付
钱包余额 0

抵扣说明:

1.余额是钱包充值的虚拟货币,按照1:1的比例进行支付金额的抵扣。
2.余额无法直接购买下载,可以购买VIP、付费专栏及课程。

余额充值