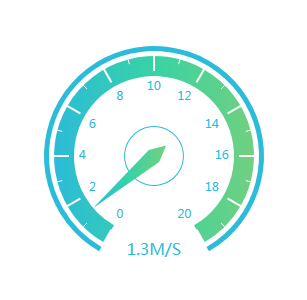
使用echarts(三)自定义图表仪表盘

自定义仪表盘

样式如下

代码如下
<html lang="en">

<head>
    <meta charset="UTF-8">
    <meta name="viewport" content="width=device-width, initial-scale=1.0">
    <!-- 引入 ECharts 文件 -->
    <script src="echarts.min.js"></script>
    <title>Document</title>
</head>

<body>
    <!-- 为 ECharts 准备一个具备大小(宽高)的 DOM -->
    <div id="main" style="width: 600px;height:400px;"></div>
    <img src="e7a7ddebae2a69f5f92a4ad8648d7ba.png" id="bg_img" style="display:none" />
    <script type="text/javascript">
        // 基于准备好的dom,初始化echarts实例
        var myChart = echarts.init(document.getElementById('main'));

        // 指定图表的配置项和数据
        var option = {

            tooltip: {
                formatter: '{a} <br/>{b} : {c}M/S'
            },
            // toolbox: {//重置,保存图片
            //     feature: {
            //         restore: {},
            //         saveAsImage: {}
            //     }
            // },
            series: [
                {
                    name: '业务指标',
                    type: 'gauge',
                    // center: ["50%", "45%"], // 仪表位置
                    // radius: "80%", //仪表大小
                    radius: 110, //半径
                    startAngle: 240,//起始角度。圆心 正右手侧为0度,正上方为90度,正左手侧为180度。
                    endAngle: -60, //结束角度。
                    min: 0,
                    max: 20,
                    //仪表盘轴线相关配置。
                    axisLine: {
                        show: true,//将图表轴线、label、分割线、隐藏,只保留刻度
                        lineStyle: {
                            color: [
                                [1, '#2bbcd9']
                            ],
                            width: 5,//表盘宽度
                            opacity: 1
                        }
                    },
                    splitLine: {
                        show: false
                    },
                    axisTick: {
                        show: false
                    },
                    axisLabel: {
                        show: false
                    },
                    pointer: { //指针样式
                        length: '45%'
                    },
                    detail: {
                        show: false
                    }
                },
                {
                    name: '业务指标',
                    type: 'gauge',
                    // center: ["50%", "45%"], // 仪表位置
                    // radius: "80%", //仪表大小
                    radius: 30, //半径
                    startAngle: 300,//起始角度。圆心 正右手侧为0度,正上方为90度,正左手侧为180度。
                    endAngle: -59.9, //结束角度。
                    min: 0,
                    max: 20,
                    axisLine: {
                        show: true,//将图表轴线、label、分割线、隐藏,只保留刻度
                        lineStyle: {
                            color: [
                                [1, '#2bbcd9']
                            ],
                            width: 1,//表盘宽度
                            opacity: 1
                        }
                    },
                    splitLine: {
                        show: false
                    },
                    axisTick: {
                        show: false
                    },
                    axisLabel: {
                        show: false
                    },
                    pointer: { //指针样式
                        length: '45%'
                    },
                    detail: {
                        show: false
                    }
                },
                {
                    name: '业务指标',
                    type: 'gauge',
                    // center: ["50%", "45%"], // 仪表位置
                    // radius: "80%", //仪表大小
                    radius: 100, //半径
                    startAngle: 240,//起始角度。圆心 正右手侧为0度,正上方为90度,正左手侧为180度。
                    endAngle: -60, //结束角度。
                    min: 0,
                    max: 20,
                    detail: { //仪表盘详情,用于显示数据。
                        formatter: '{value}M/S',
                        offsetCenter: [0, 95], // x, y,单位px
                        textStyle: {
                            color: '#2bbbd6',
                            fontSize: 16
                        }
                    },
                    axisLabel: {//刻度标签。
                        show: true,
                        color: "#2abbda",
                        fontSize: 12,
                        distance: 10,//位置  负数会显示在外层
                        formatter: function (v) {
                            return v;
                        },
                    },
                    axisTick: { //刻度样式
                        length: 5,//刻度长度
                        splitNumber: 2,// 增加刻度密度
                        lineStyle: {
                            color: "#fff",
                            // color: {
                            // image: document.getElementById('bg_img'),//刻度背景
                            // repeat: 'no-repeat'
                            // },
                            width: 1
                        },
                    },
                    splitLine: {//分隔线样式
                        show: true,
                        length: 15,
                        lineStyle: {
                            color: "#fff",
                            width: 2
                        },
                    },
                    axisLine: { //仪表盘轴线相关配置。
                        show: true,//将图表轴线、label、分割线、隐藏,只保留刻度
                        lineStyle: {
                            color: [
                                [1, new echarts.graphic.LinearGradient(0, 0, 1, 0, [{
                                    offset: 0,
                                    color: '#2cbbd9'
                                }, {
                                    offset: 0.5,
                                    color: '#37d3a4'
                                }, {
                                    offset: 1,
                                    color: '#71d07f'
                                }

                                ])]
                            ],
                            width: 20,//表盘宽度
                            opacity: 1
                        }
                    },
                    data: [{ value: 10 }]
                },
            ]
        };

        // setInterval(function () {
        option.series[2].data[0].value = (Math.random() * 10).toFixed(2) - 0;
        myChart.setOption(option, true);
        // }, 2000);

    </script>
</body>

</html>

详细参数说明: https://www.w3cschool.cn/echarts_tutorial/

  • 0
    点赞
  • 2
    收藏
    觉得还不错? 一键收藏
  • 0
    评论

“相关推荐”对你有帮助么?

  • 非常没帮助
  • 没帮助
  • 一般
  • 有帮助
  • 非常有帮助
提交
评论
添加红包

请填写红包祝福语或标题

红包个数最小为10个

红包金额最低5元

当前余额3.43前往充值 >
需支付:10.00
成就一亿技术人!
领取后你会自动成为博主和红包主的粉丝 规则
hope_wisdom
发出的红包
实付
使用余额支付
点击重新获取
扫码支付
钱包余额 0

抵扣说明:

1.余额是钱包充值的虚拟货币,按照1:1的比例进行支付金额的抵扣。
2.余额无法直接购买下载,可以购买VIP、付费专栏及课程。

余额充值