


 本文记录了一位从前端接口转向页面开发的开发者,在使用Highcharts绘制饼图时遇到的问题及解决过程。主要难点在于将后台返回的JSON数据转换为前端所需的int类型,以便计算百分比。提供的代码示例包括页面和后台部分。
感慨一下,之前一直是搞网络接口的。换了工作,现在搞前端页面了,今天搞了个图表。
遇到了点问题,最后还是搞定了。我把主要代码贴上来吧。
希望可以帮到有需要的童鞋。
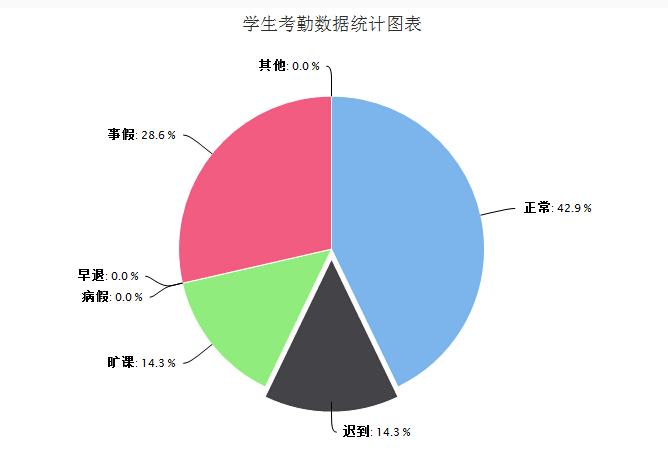
有一点需要注意,就是从后台出来的json数据,前端需要转类型。因为图表他是int型,需要计算百分比。我也在这个上面浪费了点时间。
<script type="text/javascript"src="${pageContext.request.contextPath}/web/exam/.js"></script>
这个可以去官网下载一个,有demo的。点击打开链接(演示地址)
页面代码:
var chart = null;

	$(function() {
		chart = new Highcharts.Chart(
				{
					chart : {
						renderTo : 'container', // 页面DIV层ID
						plotBackgroundColor : null,
						plotBorderWidth : null,
						plotShadow : false
					},
					title : {
						text : '学生考勤数据统计图表'
					},
					tooltip : {
						pointFormat : '{series.name}: <b>{point.percentage:.1f}%</b>'
					},
					plotOptions : {
						pie : {
							allowPointSelect :
最低0.47元/天 解锁文章


 889
889

 被折叠的 条评论
为什么被折叠?
被折叠的 条评论
为什么被折叠?
 到【灌水乐园】发言


