


未经允许,不得转载!!
水平有限,写的不周之处欢迎指正、交流!!
首先,Highcharts是什么呢?它是让数据可视化更简单,兼容IE6+、完美支持移动端、图表类型丰富、方便快捷的HTML5交互性图标库!
HTML5:Highcharts 完全基于 HTML5 技术,不需要按照按照任何插件,也不需要配置 PHP、Java 等运行环境,只需要两个 JS 文件即可使用;
丰富:Highcharts 提供丰富的图表类型,线图、柱形图、饼图、散点图、仪表图、雷达图、热力图、混合图等多,Highstock 则提供股票走势图(K线、分时)、高级时间轴图,Highmaps 提供各种丰富多样的地图;
兼容:兼容 IE6+,同时完美支持移动端触摸操作、手势缩放,并且能够保证在不同的浏览器上做到展现效果和使用体验一致性;
交互:支持动态增加、修改、删除数据列、数据点、坐标轴操作,支持多种交互操作,丰富灵活的API可以精准控制图表的每一个细节!
总之,这是一个非常优秀的数据展示库!!值得玩玩!
下面进入正题:
上效果:
上静态数据效果代码:
<!DOCTYPE html>
<html lang="en">
    <head>
        <meta charset="utf-8">
        <title>http://blog.csdn.net/ime33 AJAX异步请求数据</title>
        <script type="text/javascript" src="./js/jquery-1.11.3.js"></script>
        <script type="text/javascript" src="./js/highcharts.js"></script>
        <script type="text/javascript" src="./js/exporting.js"></script>
        <script type="text/javascript" src="http://cdn.hcharts.cn/highstock/themes/dark-unica.js"></script>
    </head>
    <body>
        <!--[if lt IE 10]>
            <div class="browserupgrade">
            在线编辑代码s 目前只支持 IE10 以上的浏览器,为了更好的体验,建议使用谷歌、火狐、IE10+ 等主流浏览器访问本站!
            </div>
        <![endif]-->
        <div id="container" style="min-width:400px;height:400px"></div>
<script type="text/javascript">
            $(function () {
// 纯静态获取数据
                $('#container').highcharts({
                    title: {
                        text: 'highcharts异步添加数据展示',
                        x: -20 //center
                    },
                    subtitle: {
                        text: '折线图',
                        x: -20
                    },
                    xAxis: {
                        categories: ['1月', '2月', '3月', '4月', '5月', '6月',
                                     '7月', '8月', '9月', '10月', '11月', '12月']
                    },
                    yAxis: {
                        title: {
                            text: '温度 (°C)'
                        },
                        plotLines: [{
                            value: 0,
                            width: 1,
                            color: '#808080'
                        }]
                    },
                    tooltip: {
                        valueSuffix: '°C'
                    },
                    legend: {
                        layout: 'vertical',
                        align: 'right',
                        verticalAlign: 'middle',
                        borderWidth: 0
                    },
                    series: [{
                        name: '江苏',
                        data: [7.0, 6.9, 9.5, 14.5, 18.2, 21.5, 25.2, 26.5, 23.3, 18.3, 13.9, 9.6]
                    }, {
                        name: '北京',
                        data: [-0.2, 0.8, 5.7, 11.3, 17.0, 22.0, 24.8, 24.1, 20.1, 14.1, 8.6, 2.5]
                    }, {
                        name: '上海',
                        data: [-0.9, 0.6, 3.5, 8.4, 13.5, 17.0, 18.6, 17.9, 14.3, 9.0, 3.9, 1.0]
                    }, {
                        name: '江西',
                        data: [3.9, 4.2, 5.7, 8.5, 11.9, 15.2, 17.0, 16.6, 14.2, 10.3, 6.6, 4.8]
                    }]
                });
            });
        </script>
</body>
</html>
上异步获取数据效果代码第一种:
<!DOCTYPE html>
<html lang="en">
<head>
<meta charset="utf-8">
<title>http://blog.csdn.net/ime33 AJAX异步请求数据</title>
<script type="text/javascript" src="./js/jquery-1.11.3.js"></script>
<script type="text/javascript" src="./js/highcharts.js"></script>
<script type="text/javascript" src="./js/exporting.js"></script>
<script type="text/javascript" src="http://cdn.hcharts.cn/highstock/themes/dark-unica.js"></script>
</head>
<body>
<!--[if lt IE 10]>
<div class="browserupgrade">
在线编辑代码s 目前只支持 IE10 以上的浏览器,为了更好的体验,建议使用谷歌、火狐、IE10+ 等主流浏览器访问本站!
</div>
<![endif]-->
<div id="container" style="min-width:400px;height:400px"></div>
<script type="text/javascript">
$(function () {
//异步加载数据第一种方式
var options={
chart:{
renderTo:'container',
type:'line'//line column
},
title:{
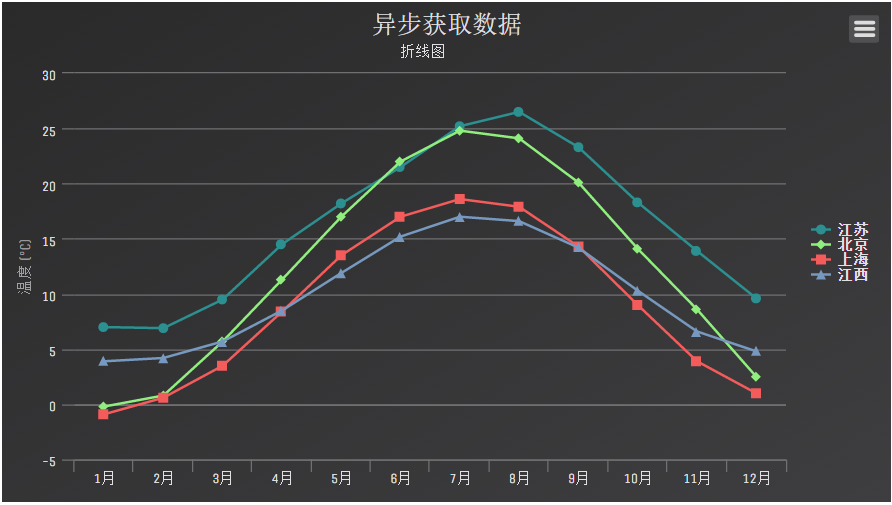
text:'异步获取数据'
},
subtitle: {
text: '折线图',
x: -20
},
xAxis: {
categories: ['1月', '2月', '3月', '4月', '5月', '6月',
'7月', '8月', '9月', '10月', '11月', '12月']
},
yAxis: {
title: {
text: '温度 (°C)'
},
plotLines: [{
value: 0,
width: 1,
color: '#808080'
}]
},
tooltip: {
valueSuffix: '°C'
},
legend: {
layout: 'vertical',
align: 'right',
verticalAlign: 'middle',
borderWidth: 0
},
Loading:{
hideDuration: 1000,//淡出效果的持续时间(以毫秒为单位)
showDuration: 1000,//淡入效果的持续时间(以毫秒为单位)
labelStyle: {//加载标签的span的CSS样式
fontStyle: 'italic',
color:'red',
fontSize:"40px"
},
style: {//覆盖在绘图区的加载页面的样式
position: 'absolute',
backgroundColor: 'white',
opacity: 0.5,
textAlign: 'center',
color:'red'
}
},
series: [{},{},{},{}]
}
var url = './js/data.json';
$.getJSON(url,function(data) {
var i,len=data.length;
//console.log(data[0].name);
for( i=0;i<len;i++){
//赋值 series
options.series[i].data = data[i].arc;
options.series[i].name = data[i].name;
console.log(options.series[i].data);
//对报表X轴显示名称赋值
//options.xAxis.categories[i]=data[i].month;//可在json数据中添加月份添加
}
var chart = new Highcharts.Chart(options);
});
});
</script>
</body>
</html>
上异步获取数据效果代码第二种:
<!DOCTYPE html>
<html lang="en">
    <head>
        <meta charset="utf-8">
        <title>http://blog.csdn.net/ime33 AJAX异步请求数据</title>
        <script type="text/javascript" src="./js/jquery-1.11.3.js"></script>
        <script type="text/javascript" src="./js/highcharts.js"></script>
        <script type="text/javascript" src="./js/exporting.js"></script>
        <script type="text/javascript" src="http://cdn.hcharts.cn/highstock/themes/dark-unica.js"></script>
    </head>
    <body>
        <!--[if lt IE 10]>
            <div class="browserupgrade">
            在线编辑代码s 目前只支持 IE10 以上的浏览器,为了更好的体验,建议使用谷歌、火狐、IE10+ 等主流浏览器访问本站!
            </div>
        <![endif]-->
        <div id="container" style="min-width:400px;height:400px"></div>

        <script type="text/javascript">
            $(function () {

// 异步加载数据第二种方式
                var options={
                    chart:{
                        renderTo:'container',
                        type:'line'//line column
                    },
                    title:{
                        text:'异步获取数据'
                    },
                    subtitle: {
                        text: '折线图',
                        x: -20
                    },
                    xAxis: {
                        categories: ['1月', '2月', '3月', '4月', '5月', '6月',
                                     '7月', '8月', '9月', '10月', '11月', '12月']
                    },
                    yAxis: {
                        title: {
                            text: '温度 (°C)'
                        },
                        plotLines: [{
                            value: 0,
                            width: 1,
                            color: '#808080'
                        }]
                    },
                    tooltip: {
                        valueSuffix: '°C'
                    },
                    legend: {
                        layout: 'vertical',
                        align: 'right',
                        verticalAlign: 'middle',
                        borderWidth: 0
                    },
                    Loading:{
                        hideDuration: 1000,//淡出效果的持续时间(以毫秒为单位)
                        showDuration: 1000,//淡入效果的持续时间(以毫秒为单位)
                        labelStyle: {//加载标签的span的CSS样式
                            fontStyle: 'italic',
                            color:'red',
                            fontSize:"40px"
                        },
                        style: {//覆盖在绘图区的加载页面的样式
                            position: 'absolute',
                            backgroundColor: 'white',
                            opacity: 0.5,
                            textAlign: 'center',
                            color:'red'
                        }
                    },
                    credits: {
                        enabled: false
                    },
                    series: []
                }
                var oChart = null;
                oChart = new Highcharts.Chart(options);
                Load_SeriesData();

                function Load_SeriesData(){
                    oChart.showLoading("Loading....");
                    $.ajax({
                        url : './js/data.json',
                        type : 'POST',
                        dataType : 'json',
                        contentType: "application/x-www-form-urlencoded; charset=utf-8",
                        success : function(Data){
                            console.log(Data);
                            for(i=0; i<Data.length;i++){
                                var DataSeries = {
                                    name: Data[i].name,
                                    data: Data[i].arc
                                };
                                oChart.addSeries(DataSeries);
                            }
                            oChart.hideLoading("Loading....");
                        }
                    });

                }
});
        </script>
    </body>
</html>
最后上我的JSON数据文件:
[
    {
        "name":"江苏",
        "arc":[7.0, 6.9, 9.5, 14.5, 18.2, 21.5, 25.2, 26.5, 23.3, 18.3, 13.9, 9.6]
    },
    {
        "name":"北京",
        "arc":[-0.2, 0.8, 5.7, 11.3, 17.0, 22.0, 24.8, 24.1, 20.1, 14.1, 8.6, 2.5]
    },
    {
        "name":"上海",
        "arc":[-0.9, 0.6, 3.5, 8.4, 13.5, 17.0, 18.6, 17.9, 14.3, 9.0, 3.9, 1.0]
    },{
        "name":"江西",
        "arc":[3.9, 4.2, 5.7, 8.5, 11.9, 15.2, 17.0, 16.6, 14.2, 10.3, 6.6, 4.8]
    }
]
水平有限欢迎指正、交流,感谢阅读!!
附上highcharts官网以及API文档,看文档对英文还有有点要求的呀!总之,是一个好玩的东西!值得大家上手试试!!


 4551
4551

 被折叠的 条评论
为什么被折叠?
被折叠的 条评论
为什么被折叠?
 到【灌水乐园】发言


