


 本文介绍了在PyTorch中使用不同工具来可视化ResNet-18网络结构,包括使用torchprint打印基本信息,torchsummary展示参数量和shape,torchviz通过backward过程绘制网络,hiddenlayer支持结构压缩展示,torchview绘制图形,以及netron对模型文件进行可视化。
在PyTorch中,有几种不同的工具可以用于网络结构的可视化。下面我将以ResNet-18为例,展示如何使用常用的PyTorch画图工具进行网络结构的可视化。
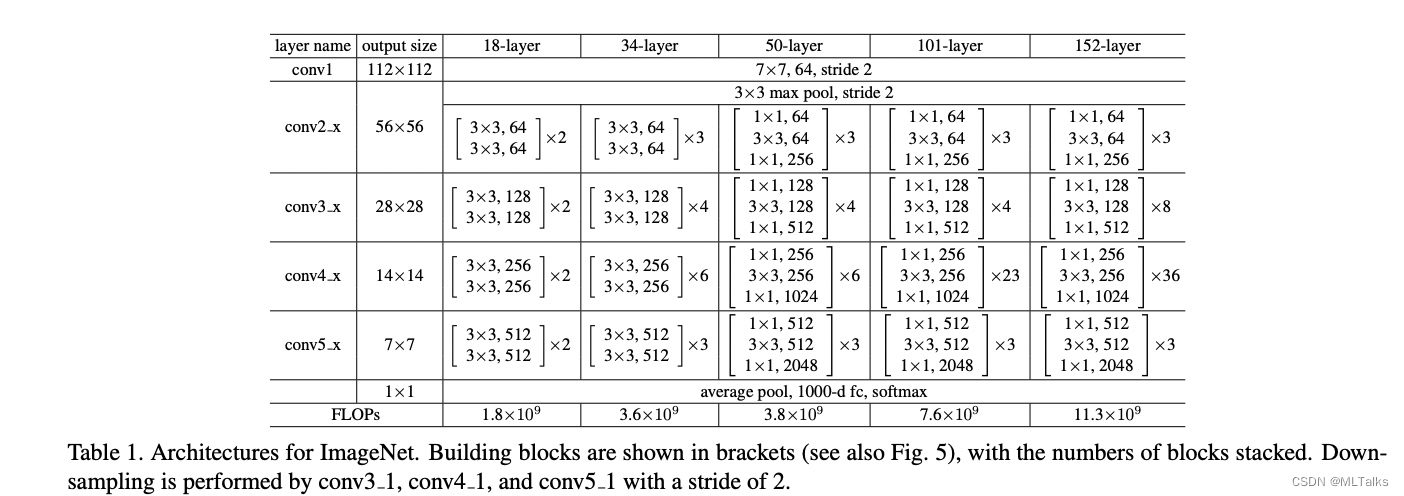
ResNet-18是一个经典的卷积神经网络模型,由多个卷积层、池化层、全连接层和残差连接(Residual Connection)组成。参考Deep Residual Learning for Image Recognition,网络结构如下:
在PyTorch中可以能过torchvision快速使用ResNet-18,使用代码如下:
from torchvision.models import resnet18
x = torch.randn(1, 3, 224, 224)
model = resnet18()
x是随机生成的输入数据,model是resnet18的实例。
1. torch print
使用torch自带的print方法。torch的model支持直接print打印,可以看到详细的网络结构。
使用示例:
print(model)
结果如下:
ResNet(
  (conv1): Conv2d(3, 64, kernel_size=(7, 7), stride=(2, 2), padding=(3, 3), bias=False)
  (bn1): BatchNorm2d(64, eps=1e-05, momentum=0.1, affine=True, track_running_stats=True)
  (relu): ReLU(inplace=True)
  (maxpool): MaxPool2d(kernel_size=3, stride=2, padding=1, dilation=1, ceil_mode=False)
  (layer1): Sequential(
    (0): BasicBlock(
      (conv1): Conv2d(64, 64, kernel_size=(3, 3), stride=(1, 1), padding=(1, 1), bias=False)
      (bn1): BatchNorm2d(64, eps=1e-05, momentum=0.1, affine=True, track_running_stats=True)
      (relu): ReLU(inplace=True)
      (conv2): Conv2d(64, 64, kernel_size=(3, 3), stride=(1, 1), padding=(1, 1), bias=False)
      (bn2): BatchNorm2d(64, eps=1e-05, momentum=0.1, affine=True, track_running_stats=True)
    )
    (1): BasicBlock(
      (conv1): Conv2d(64, 64, kernel_size=(3, 3), stride=(1, 1), padding=(1, 1), bias=False)
      (bn1): BatchNorm2d(64, eps=1e-05, momentum=0.1, affine=True, track_running_stats=True)
      (relu): ReLU(inplace=True)
      (conv2): Conv2d(64, 64, kernel_size=(3, 3), stride=(1, 1), padding=(1, 1), bias=False)
      (bn2): BatchNorm2d(64, eps=1e-05, momentum=0.1, affine=True, track_running_stats=True)
    )
  )
......
2. torchsummary
代码库:https://github.com/sksq96/pytorch-summary
使用torchsummary进行model的打印,展示的信息比print会多出来参数量和shape信息
安装:
pip install torchsummary
使用示例:
from torchsummary import summary
summary(model, x.squeeze(dim=0).shape)
结果如下:
----------------------------------------------------------------
        Layer (type)               Output Shape         Param #
================================================================
            Conv2d-1         [-1, 64, 112, 112]           9,408
       BatchNorm2d-2         [-1, 64, 112, 112]             128
              ReLU-3         [-1, 64, 112, 112]               0
         MaxPool2d-4           [-1, 64, 56, 56]               0
            Conv2d-5           [-1, 64, 56, 56]          36,864
       BatchNorm2d-6           [-1, 64, 56, 56]             128
              ReLU-7           [-1, 64, 56, 56]               0
            Conv2d-8           [-1, 64, 56, 56]          36,864
       BatchNorm2d-9           [-1, 64, 56, 56]             128
             ReLU-10           [-1, 64, 56, 56]               0
       BasicBlock-11           [-1, 64, 56, 56]               0
           Conv2d-12           [-1, 64, 56, 56]          36,864
      BatchNorm2d-13           [-1, 64, 56, 56]             128
             ReLU-14           [-1, 64, 56, 56]               0
           Conv2d-15           [-1, 64, 56, 56]          36,864
      BatchNorm2d-16           [-1, 64, 56, 56]             128
             ReLU-17           [-1, 64, 56, 56]               0
       BasicBlock-18           [-1, 64, 56, 56]               0
           Conv2d-19          [-1, 128, 28, 28]          73,728
      BatchNorm2d-20          [-1, 128, 28, 28]             256
             ReLU-21          [-1, 128, 28, 28]               0
           Conv2d-22          [-1, 128, 28, 28]         147,456
3. torchviz
代码库:https://github.com/szagoruyko/pytorchviz
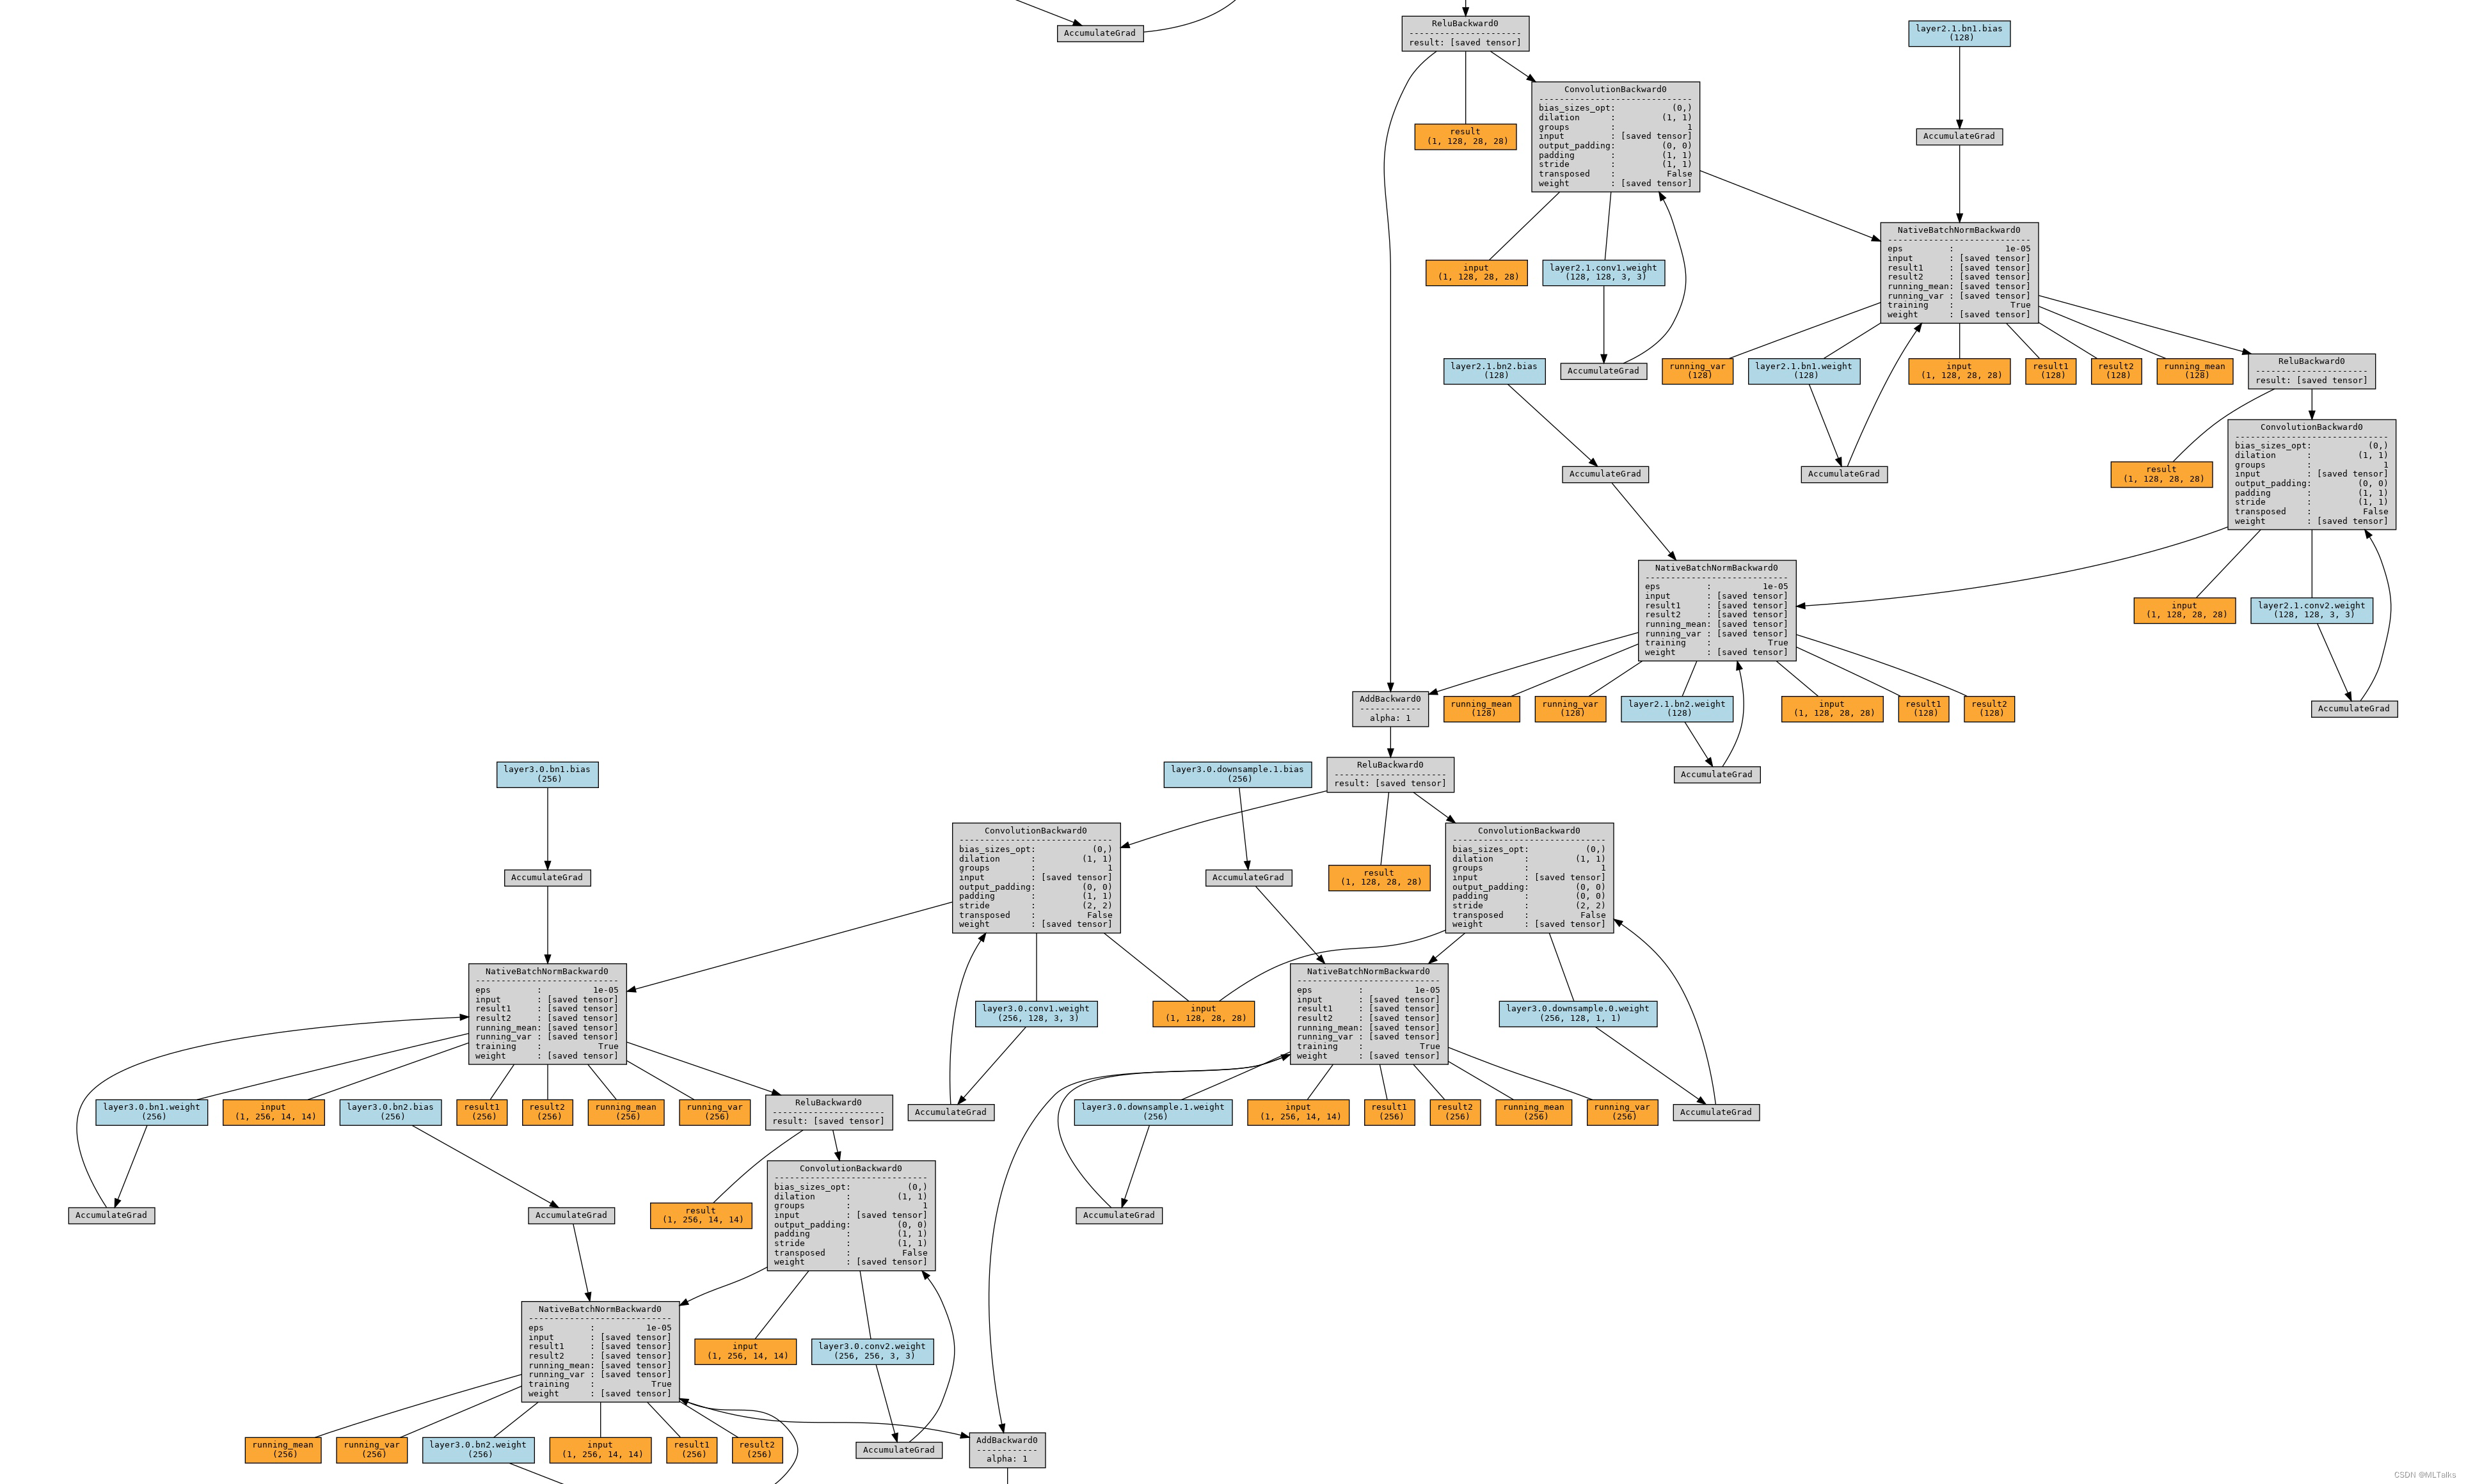
使用torchviz进行可视化(需要安装torchviz和graphviz)。torchviz会通过backward的过程对整个网络进行展示。
安装:
apt install python3-pydot python3-pydot-ng graphviz xdg-utils
pip install torchviz
使用示例, 保存图片到文件中,如果终端直接展示的话render函数中的view配置改为True:
from torchviz import make_dot
y = model(x)
output = make_dot(y.mean(), params=dict(model.named_parameters()), show_attrs=True, show_saved=True)
output.format = "png"
output.directory = "."
output.render("torchviz", view=False)
结果如下:
4. hiddenlayer
代码库:https://github.com/waleedka/hiddenlayer
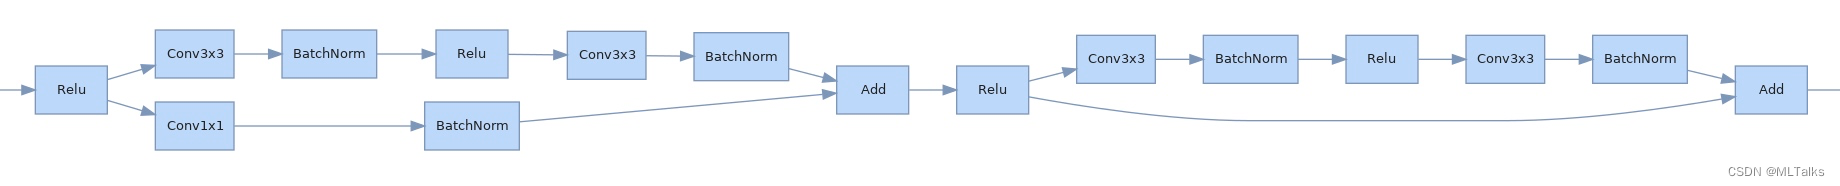
hiddenlayer跟之前比的一个特色在于,hiddenlayer中支持transforms配置,可以对指定的多个连续算子进行fusion展示,以及有多个重复的结构的话可以进行fold压缩展示。
安装:
pip install matplotlib
pip install hiddenlayer
使用示例:
import hiddenlayer as hl
transforms = [
    # Fold repeated blocks
    hl.transforms.FoldDuplicates(),
]
graph = hl.build_graph(model, x, transforms=transforms)
graph.theme = hl.graph.THEMES['blue'].copy()
graph.save('hiddenlayer', format='png')
结果如下:
5. torchview
代码库:https://github.com/mert-kurttutan/torchview
安装:
pip install torchview
使用示例:
from torchview import draw_graph

model_graph = draw_graph(model, input_size=x.shape, expand_nested=True, save_graph=True, filename="torchview", directory=".")

model_graph.visual_graph
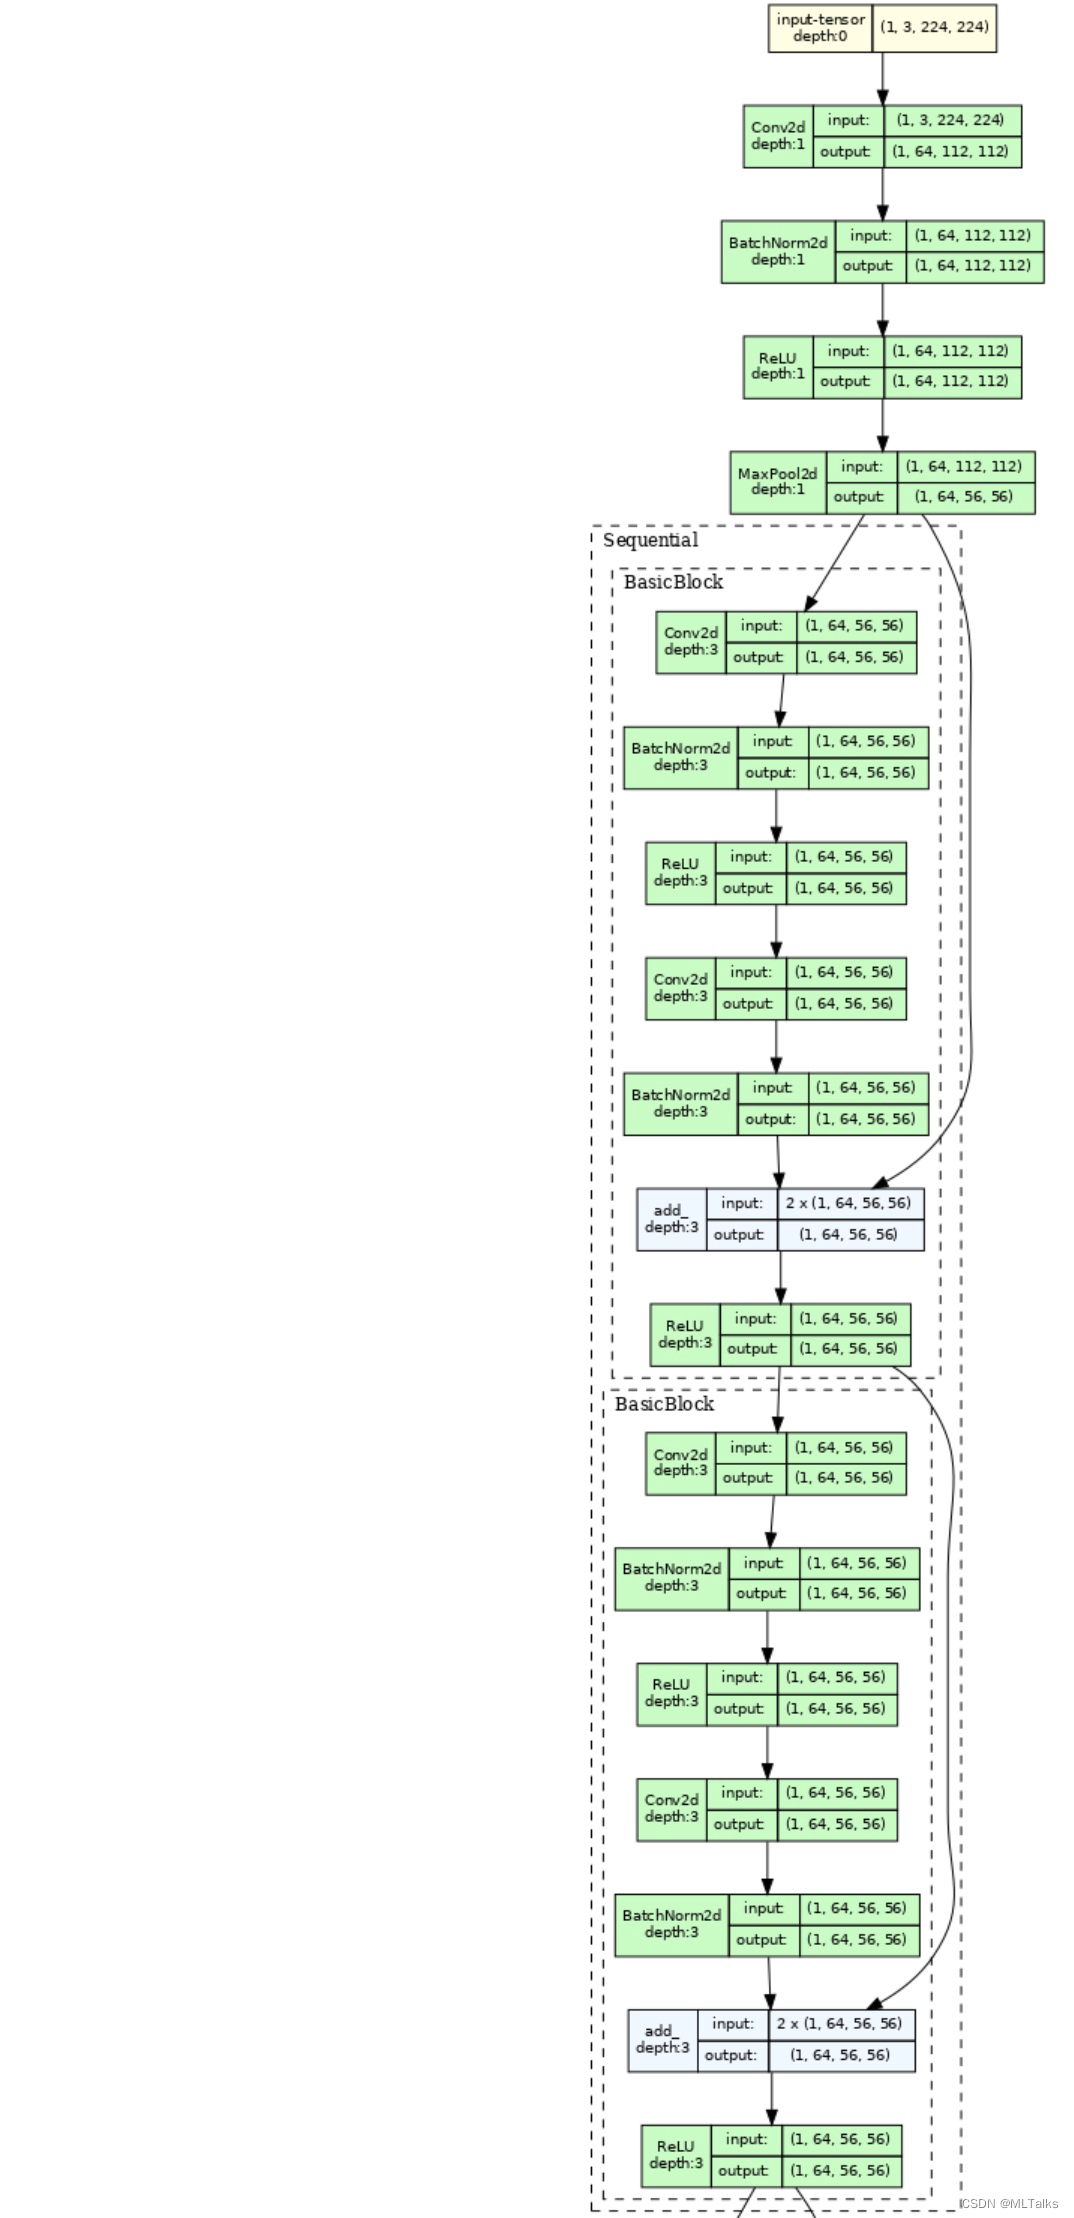
结果如下:
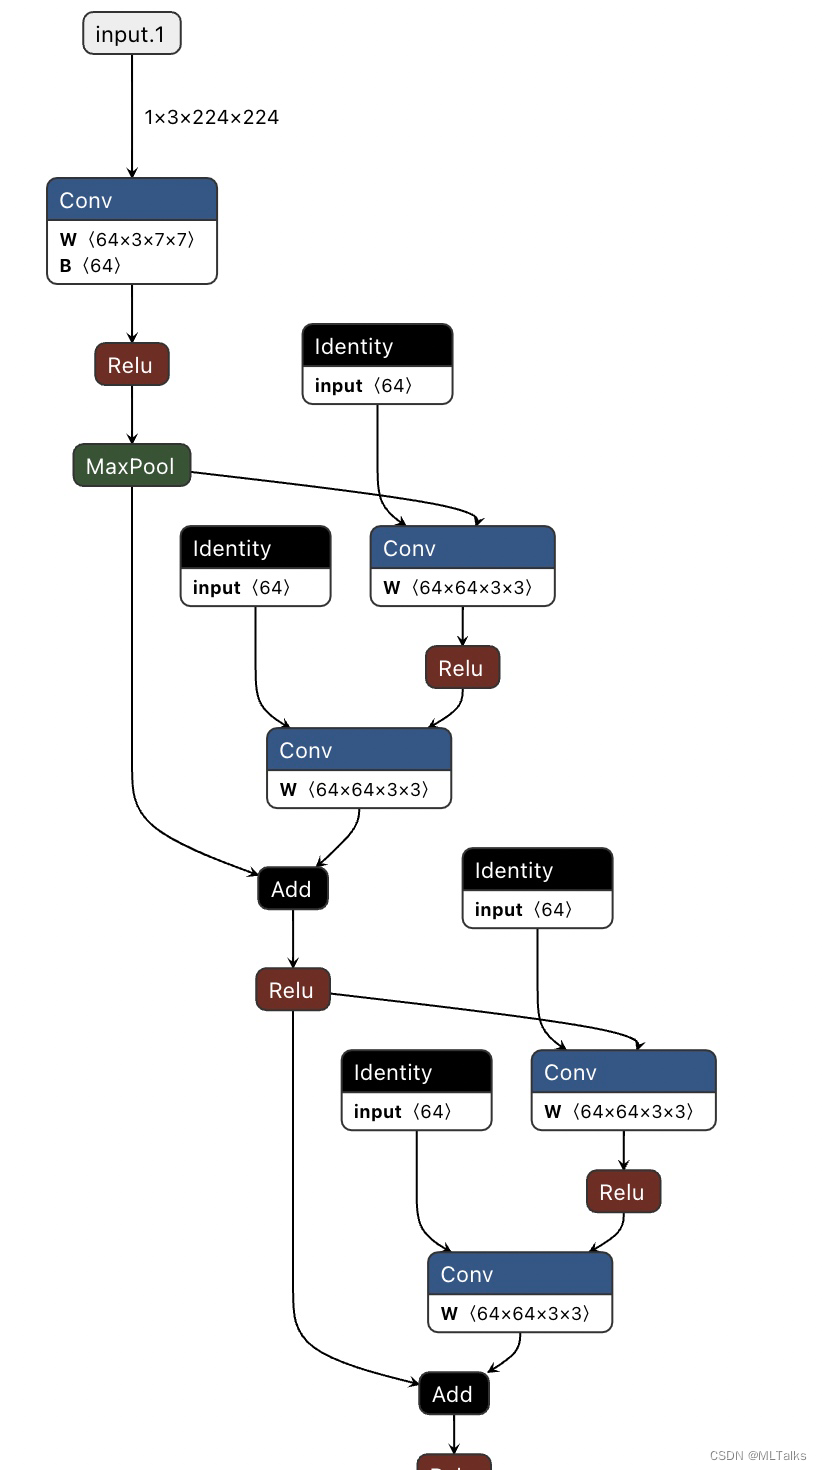
6. netron
代码库:https://github.com/lutzroeder/netron
netron可以对保存的模型文件进行可视化展示。介绍中支持的格式有:
Netron supports ONNX, TensorFlow Lite, Caffe, Keras, Darknet, PaddlePaddle, ncnn, MNN, Core ML, RKNN, MXNet, MindSpore Lite, TNN, Barracuda, Tengine, CNTK, TensorFlow.js, Caffe2 and UFF.
安装:
pip install onnx
pip install netron
使用示例:
onnx_file_path = "resnet18.onnx"
torch.onnx.export(model, x, onnx_file_path, verbose=True)
使用netron导入resnet18.onnx文件,结果如下:
7. 完整代码
#!/usr/bin/env python

import torch
import torch.nn as nn
from torchvision.models import resnet18

def draw_torchsummary(model, x):
    from torchsummary import summary
    summary(model, x.squeeze(dim=0).shape)

def draw_torchviz(model, x):
    from torchviz import make_dot
    y = model(x)
    output = make_dot(y.mean(), params=dict(model.named_parameters()), show_attrs=True, show_saved=True)
    output.format = "png"
    output.directory = "."
    output.render("torchviz", view=False)

def draw_torchview(model, x):
    from torchview import draw_graph
    model_graph = draw_graph(model, input_size=x.shape, expand_nested=True, save_graph=True, filename="torchview", directory=".")
    #model_graph.visual_graph

def draw_hiddenlayer(model, x):
    import hiddenlayer as hl
    transforms = [
        # Fold repeated blocks
        hl.transforms.FoldDuplicates(),
    ]
    graph = hl.build_graph(model, x, transforms=transforms)
    graph.theme = hl.graph.THEMES['blue'].copy()
    graph.save('hiddenlayer', format='png')

def draw_netron(model, x):
    onnx_file_path = "resnet18.onnx"
    torch.onnx.export(model, x, onnx_file_path, verbose=True)

if __name__ == "__main__":
    x = torch.randn(1, 3, 224, 224)
    model = resnet18()
    print(model)
    draw_torchsummary(model, x)
    draw_torchviz(model, x)
    draw_hiddenlayer(model, x)
    draw_torchview(model, x)
    draw_netron(model, x)


 1714
1714

 被折叠的 条评论
为什么被折叠?
被折叠的 条评论
为什么被折叠?
 到【灌水乐园】发言


