


ELK简介
什么是日志
日志就是程序产生的,遵循一定格式(通常包含时间戳)的文本数据。
ELK常见的架构
Elasticsearch + Logstash + Kibana
这是一种最简单的架构。这种架构,通过logstash收集日志,Elasticsearch分析日志,然后在Kibana(web界面)中展示。这种架构虽然是官网介绍里的方式
通常日志由服务器生成,输出到不同的文件中,一般会有系统日志、 应用日志、安全日志。这些日志分散地存储在不同的机器上。
基础环境:
操作系统:Centos Linux release 7.4.1708
关闭防火墙、selinux
sed -ri '/^[^#]*SELINUX=/s#=.+$#=disabled#' /etc/selinux/config
systemctl stop firewalld
systemctl disable firewalld
主机名解析:192.168.100.10 ELK
Elasticsearch 部署
添加yum仓库
添加yum仓库
vim /etc/yum.repos.d/elasticsearch.repo

[elasticsearch]
name=Elasticsearch repository for 8.x packages
baseurl=https://artifacts.elastic.co/packages/8.x/yum
gpgcheck=1
gpgkey=https://artifacts.elastic.co/GPG-KEY-elasticsearch
enabled=1
autorefresh=1
type=rpm-md
下载并安装elasticsearch的yum源的密钥
rpm --import https://artifacts.elastic.co/GPG-KEY-elasticsearch安装elasticsearch
yum install -y elasticsearch安装java环境
 yum install -y  java
[root@localhost /]# java -version
openjdk version "1.8.0_332"
OpenJDK Runtime Environment (build 1.8.0_332-b09)
OpenJDK 64-Bit Server VM (build 25.332-b09, mixed mode)
修改配置文件
vim /etc/elasticsearch/elasticsearch.yml

path.data: /var/lib/elasticsearch

path.logs: /var/log/elasticsearch

network.host: 0.0.0.0

http.port: 9200

xpack.security.enabled: false
创建文件夹 并授权 如上的 pat.data=
[root@ELK ]# mkdir  /data/elasticsearch
[root@ELK]#  chown -R elasticsearch:elasticsearch  /data/elasticsearch/
启动
systemctl daemon-reload
systemctl enable elasticsearch.service
systemctl start elasticsearch.service
启动web测试
ss -anpt |egrep "9200|9300"
LISTEN     0      128         :::9200                    :::*                   users:(("java",pid=2053,fd=372))
LISTEN     0      128         :::9300                    :::*                   users:(("java",pid=2053,fd=368))
ESTAB      0      0         ::ffff:127.0.0.1:9200                  ::ffff:127.0.0.1:49888               users:(("java",pid=2053,fd=544))
ESTAB      0      0         ::ffff:127.0.0.1:9200                  ::ffff:127.0.0.1:49698               users:(("java",pid=2053,fd=438))
web测试 :http://192.168.100.10:9200

下载安装logstash 启动 logstash
yum install -y logstash
systemctl restart elasticsearch
修改配置文件
vim /etc/logstash/logstash-sample.conf
# Sample Logstash configuration for creating a simple
# Beats -> Logstash -> Elasticsearch pipeline.

input {
  beats {
    port => 5044
  }
}

 tcp {
    mode => "server"
    host => "0.0.0.0"
    port => 4560
    codec => json_lines
   }

   rabbitmq {
        host=>"localhost"
        vhost => "/"
        port=> 5672
        user=>"guest"
        password=>"guest"
        queue=>"station_Route"
        durable=> true
        codec=>json
 }

output {
  elasticsearch {
    hosts => ["http://ip:9200"]
    index => "rabbitmq-%{+YYYY.MM.dd}"
    #user => "elastic"
    #password => "changeme"
  }
}
安装 kibana
yum install kibana.x86_64 -y修改配置文件
vim /etc/kibana/kibana.yml

6行   server.port: 5601
11行  server.host: "0.0.0.0"
32行  server.name: "test-kin"
43行  elasticsearch.hosts: ["http://localhost:9200"]
114行 i18n.locale: "zh-CN"
启动kibana
systemctl start kibana.service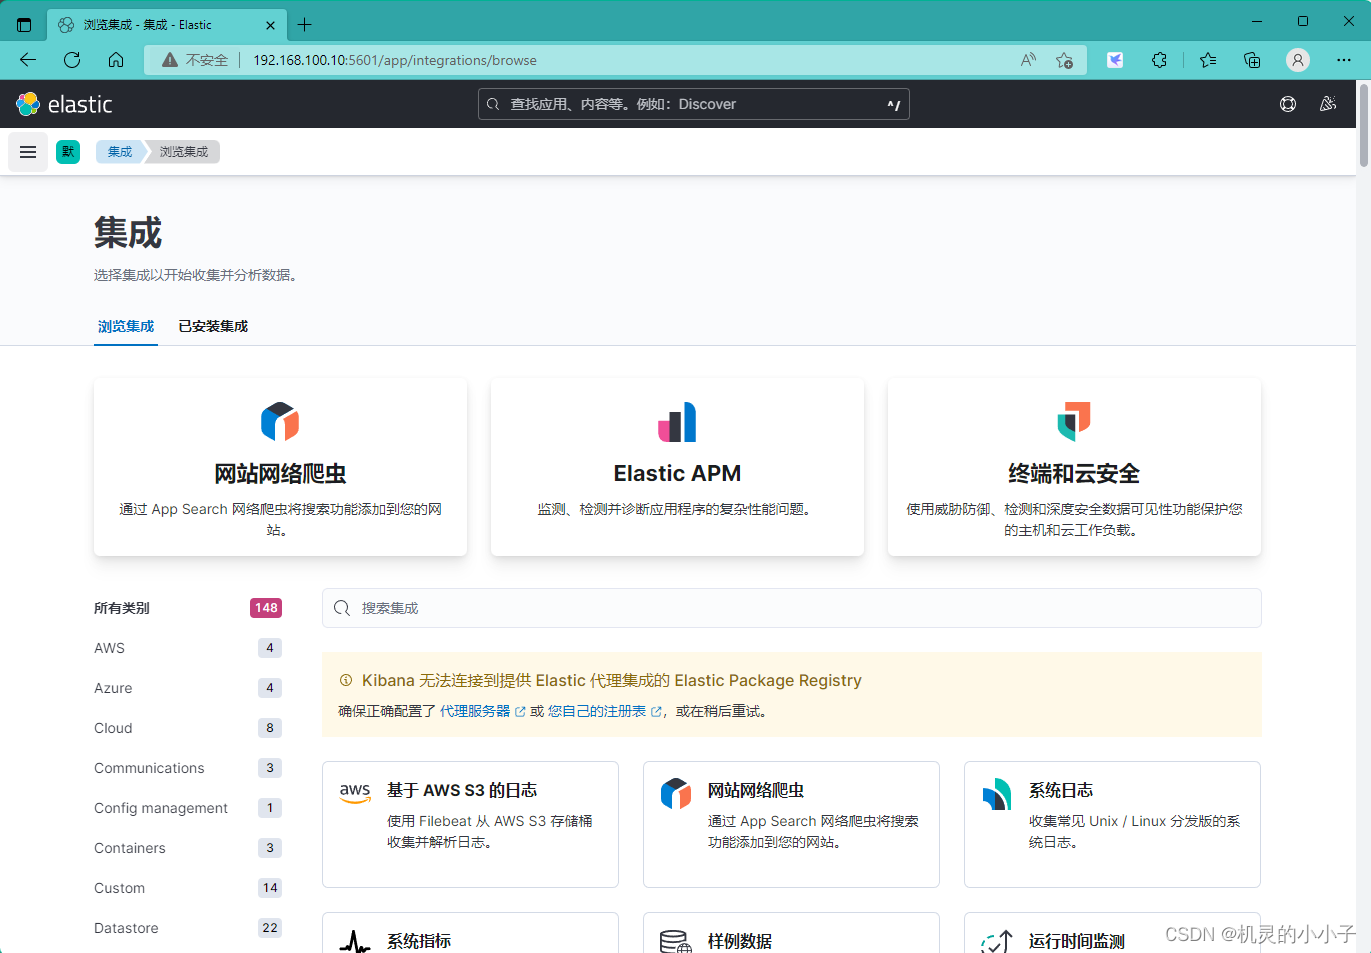
systemctl restart kibana.service访问搭建地址为:http://192.168.100.10:5601/

点击自己浏览


 239
239


 被折叠的 条评论
为什么被折叠?
被折叠的 条评论
为什么被折叠?
 到【灌水乐园】发言


