


环境
Python 3.8.10
windows 10 专业版
node v16.16.0
superset1.5
一、\superset\superset-frontend\src\visualizations
1、在\superset\superset-frontend\src\visualizations下新增几个对应的文件
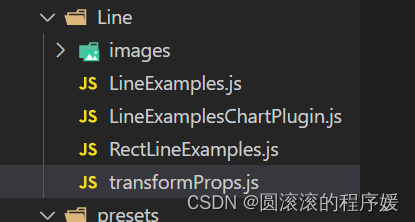
images -----> 存放新增图表的预览图
LineExamples.js ------> 新图表渲染逻辑
LineExamplesChartPlugin.js ---------> superset中渲染构造新图表
RectLineExamples.js ---------------> 注册新图表
transformProps.js ---------------> 前后端数据传递
注:需要创建什么组件,就要新增一个对应的文件夹,名为xxx,文件夹下有xxx.js、xxxChartPlugin.js、Rectxxx.js、transformProps.js,images下有thumbnail.png
2、 images下新增预览图
thumbnail.js、thumbnailLager.js
图片下载:Examples - Apache ECharts
找到对应的图片,右键图片另存为
3、LineExamples.js
import * as echarts from 'echarts';
import * as d3 from 'd3';
import PropTypes from 'prop-types';
import { CategoricalColorNamespace } from '@superset-ui/core';

// 数据类型检查
const propTypes = {
  data: PropTypes.object,
  width: PropTypes.number,
  height: PropTypes.number,
};

function LineExamples(element, props) {
  const { width, height, formData, x_data, series, legend } = props; // transformProps.js 返回的数据

  const fd = formData;
  // 配置y轴显示信息
  const y_min = fd.yMin;
  const y_max = fd.yMax;
  // y轴别名
  const y_axis_label = fd.yAxisLabel;

  // y轴配置格式
  const yAxis = {
    type: 'value',
    name: 'Y_Axis',
    axisLabel: {
      formatter: '{value}',
    },
  };

  if (y_min !== undefined) {
    yAxis.mix = y_min;
  }
  if (y_max != undefined) {
    yAxis.max = y_max;
  }

  if (y_axis_label != undefined) {
    yAxis.name = y_axis_label;
  }

  const div = d3.select(element);
  const sliceId = `line-${fd.sliceId}`;
  const html = `<div id=${sliceId} style="height:${height}px; width:${width}px;"></div>`;
  div.html(html);
  // init echarts,light 为制定主题,可以查看官方api

  const myChart = echarts.init(document.getElementById(sliceId), 'light');
  // echarts 渲染图表的数据格式 在官网可以查看
  const option = {
    xAxis: {
      type: 'category',
      data: x_data
    },
    legend: {
        data: legend, // [] x轴的数据
    },
    yAxis: yAxis,
    series,
  };

  myChart.setOption(option);
}

LineExamples.displayName = 'Line';
LineExamples.propTypes = propTypes;

export default LineExamples;
4.LineExamplesChartPlugin.js
import { t, ChartMetadata, ChartPlugin } from '@superset-ui/core';
import transformProps from './transformProps';
import thumbnail from './images/thumbnail.png';

const metadata = new ChartMetadata({
  name: t('Line'),
  description: '',
  credits: ['https://www.echartsjs.com/examples/en/editor.html?c=mix-line-bar'],
  thumbnail,
  useLegacyApi: true,
});

export default class LineExamplesChartPlugin extends ChartPlugin {
  constructor() {
    super({
      metadata,
      transformProps,
      loadChart: () => import('./RectLineExamples.js'), // 前端渲染逻辑
    });
  }
}
5、RectLineExamples.js
import {reactify} from '@superset-ui/core';
import Component from './LineExamples';

export default reactify(Component);
6、transformProps.js
export default function transformProps(chartProps) {
    const { width, height, queriesData, formData } = chartProps;
    // formData 前端页面的数据 queriesData 后端返回的数据
    return {
      data: queriesData[0].data,
      width,
      height,
      formData,
      legend: queriesData[0].data.legend,
      x_data: queriesData[0].data.x_data,
      series: queriesData[0].data.data,
    };
  }
二、注册插件流程
1、superset\superset-frontend\src\visualizations\presets\MainPreset.js文件
注册插件
import LineExamplesChartPlugin from '../Line/LineExamplesChartPlugin';
new LineExamplesChartPlugin().configure({ key: 'line_examples' }),
2、\superset\superset-frontend\src\explore\components\controls\VizTypeControl\VizTypeGallery.tsx
//找到DEFAULT_ORDER,末尾添加
'line_examples'
3、superset\superset-frontend\src\explore\controlPanels\LineExamples.js
左侧面板配置文件
/**
* https://echarts.apache.org/examples/zh/editor.html?c=mix-line-bar
* mix line bar
*/
import { t, validateNonEmpty } from '@superset-ui/core';
const metrics = {
type: 'MetricsControl',
multi: true,
label: t('Metrics'),
validators: [validateNonEmpty],
mapStateToProps: state => {
const { datasource } = state;
return {
columns: datasource ? datasource.columns : [],
savedMetrics: datasource ? datasource.metrics : [],
datasource,
};
},
description: t('One or many metrics to display'),
};
export default {
requiresTime: true,
controlPanelSections: [
{
label: t('Chart Options'),
expanded: true,
controlSetRows: [
['color_scheme', 'label_colors'],
],
},
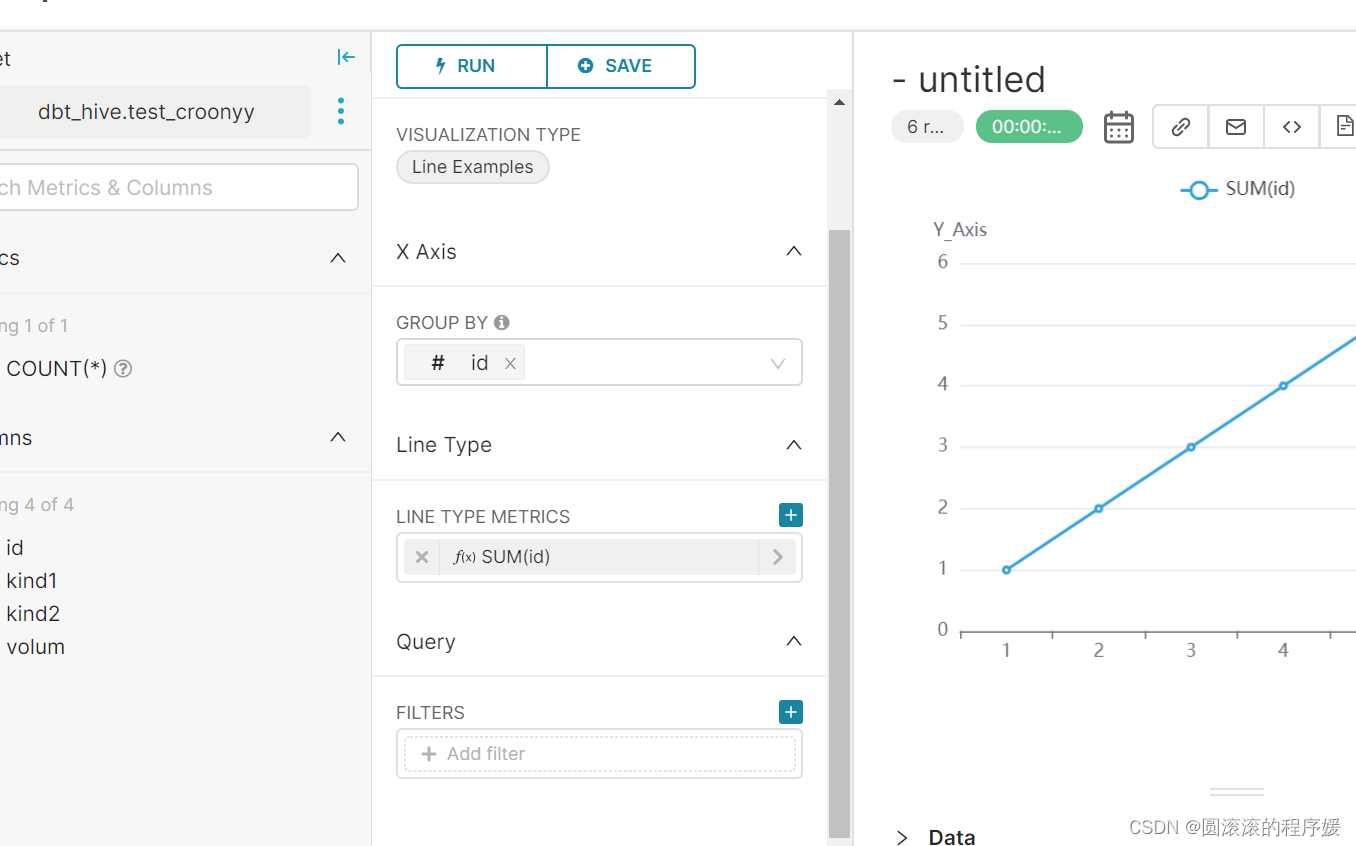
{
label: t('X Axis'),
expanded: true,
controlSetRows: [
['groupby'],
],
},
{
label: t('Line Type'),
expanded: true,
controlSetRows: [
[{
name: 'line_metrics',
config: {
...metrics, // 继承
multi: true, // 多选
clearable: true, // 是否可调用, true当作sql
validators: [], // 是否可以为空
label: t('Line Type Metrics'),
description: t('Metrics for which line type are to be displayed'),
}
}],
],
},
{
label: t('Y Axis Scale Value Setting'),
expanded: true,
controlSetRows: [
[{
name: 'y_min',
config: {
type: 'TextControl', //文本输入
label: t('Y Min'),
renderTrigger: true,
isInt: true,
description: t('Y Min'),
},
}, {
name: 'y_max',
config: {
type: 'TextControl',
label: t('Y Max'),
renderTrigger: true,
isInt: true,
description: t('Y Max'),
}
}],
[{
name: 'y_axis_label',
config: {
type: 'TextControl',
label: t('Y Axis Label'),
renderTrigger: true,
default: '',
},
}]
],
},
{
label: t('Query'),
expanded: true,
controlSetRows: [
['adhoc_filters', ['row_limit'], ['limit']],
],
},
],
// controlOverrides: { },
};
5、superset\superset-frontend\src\setup\setupPlugins.ts
import LineExamples from '../explore/controlPanels/LineExamples';
.registerValue('line_examples', LineExamples)
三、后端注册插件部分,并添加数据查询返回方法
1、superset\superset\viz.py
// 找到 METRIC_KEYS 变量 数组末尾添加1个字符串(自定义的组件)
"line_metrics"
2、superset\superset\viz.py 里 def get_subclasses 之前添加
class LineExamplesViz(NVD3Viz):
    """ line"""
    viz_type = "line_examples"
    verbose_name = _("Line")
    # 是否排序
    sort_series = False
    # 是否对time 做处理 _timestamp
    is_timeseries = False

    def query_obj(self):
        # check bar column, line column 是否重复
        # bar_metrics = self.form_data.get('bar_metrics')
        line_metrics = self.form_data.get('line_metrics')
        # if not bar_metrics and not line_metrics:
        # if not line_metrics:
        #     raise Exception(_("Please choose metrics on line or bar type"))
        # bar_metrics = [] if not bar_metrics else bar_metrics
        line_metrics = [] if not line_metrics else line_metrics
        d = super().query_obj()
        return d

    def to_series(self, df, classed=""):
        """
         拼接 前端渲染需要的数据
        :param df:
        :param classed:
        :return: {'legend':[], 'bar':[], 'line':[]}
        """
        cols = []
        for col in df.columns:
            if col == "":
                cols.append("N/A")
            elif col is None:
                cols.append("NULL")
            else:
                cols.append(col)
        df.columns = cols
        series = df.to_dict("series")
        line_metrics = self.form_data.get('line_metrics', [])
        line_metrics = [] if not line_metrics else line_metrics

        metrics = self.all_metrics
        legend, data = [], []
        for mt in metrics:
            m_label = utils.get_metric_name(mt)
            ys = series[m_label]
            if df[m_label].dtype.kind not in "biufc":
                continue
            legend.append(m_label)
            info = {
                "name": m_label,
                "data": [
                    ys.get(ds, None) for ds in df.index
                ],
                "type": ''
            }
            if mt in line_metrics:
                info['type'] = 'line'
            else:
                continue
            data.append(info)
        chart_data = {
            'legend': legend,
            'data': data,
            'x_data': [str(ds) if not isinstance(ds, tuple) else ','.join(map(str, ds)) for ds in df.index]
        }

        return chart_data

    def get_data(self, df: pd.DataFrame):
        # 后端返回的数据
        df = df.pivot_table(index=self.groupby, values=self.metric_labels)
        chart_data = self.to_series(df)
        return chart_data
四、下载前端依赖
进入superset-fontend
npm install echarts
npm install d3
五、前后端编译完成即可
参考:superset二次开发-添加echarts图表:mix-line-bar_CoCo拓海的博客-CSDN博客_superset增加图表


 561
561


 被折叠的 条评论
为什么被折叠?
被折叠的 条评论
为什么被折叠?
 到【灌水乐园】发言


