


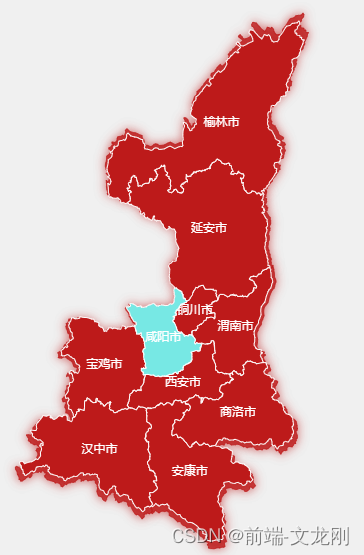
最近做了一个需求:利用Echarts做一个单独省份的地图,并配置它的背景颜色以及选中效果,这里以陕西为例
效果图:
第一步:导入JQ和Echarts库
<script type="text/javascript" src="assets/js/jquery.min.js"></script>
<script type="text/javascript" src="assets/js/echarts.min.js"></script>
第二步:设置地图元素
<div id="container" style="height:650px;width:590px;"></div>
第三步:配置JS代码
<script type="text/javascript">
    var dom = document.getElementById('container');
    var myChart = echarts.init(dom, null, {
      renderer: 'canvas',
      useDirtyRect: false
    });
    var app = {};
    var ROOT_PATH = 'https://echarts.apache.org/examples';
    var option;
    var domImg = 'https://himg.bdimg.com/sys/portraitn/item/public.1.9ce35b12.tDqVTpK3Islrbqhp553N1A'

    myChart.showLoading();
$.get('https://geo.datav.aliyun.com/areas_v3/bound/610000_full.json', function (geoJson) {
  myChart.hideLoading();
  echarts.registerMap('shanxi', geoJson);
  myChart.setOption(
    (option = {
//  	backgroundColor: 'rgba(0,0,0,0)',
//  	visualMap: {
      min: 0,
      max: 100, // 根据需求调整最大值
//      calculable: false,
//      inRange: {
//          color:'RGBA(189, 26, 26, 0.8)' // 这里将所有区域都设置成红色
//      }
//  },
//    title: {
//    	show:false,
//      text: '这是大标题',
//      backgroundColor:'purple',//背景色
//      left:'center',//居中
//      subtext: '这是副标题',
//      sublink:'https://www.baidu.com/',//这是数据来源连接
//      shadowColor:'blue',
//      textStyle:{//大标题文字样式
//      	color:'#c20007',
//      	fontSize:'24',
//      	textShadowColor:'gray',
//      },
//      subtextStyle:{//副标题样式
//      	fontSize:'24',
//      	color:'#fff'
//      }
//    },
      tooltip: {
        trigger: 'item',
//      formatter: '{b}<br/>{c}'
		formatter: '{b}',
//		position: function (point, params, dom, rect, size) {
//            // 鼠标坐标和提示框位置的参考坐标系
//            let x = 0 // x坐标位置
//            let y = 0// y坐标位置
//            const pointX = point[0]
//            const pointY = point[1]
//            const boxHeight = size.contentSize[1]
//            if (size.contentSize[0] > pointX) {
//              x = 5
//            } else {
//              x = pointX - 10
//            }
//            if (boxHeight > pointY) {
//              y = 5
//            } else {
//              y = pointY - boxHeight - 10
//            }
//            return [x, y]
//          },
            backgroundColor:'rgba(0,0,0,0.35)',//飘窗的背景色
            borderColor: 'RGBA(189, 26, 26, 0.8)',
//          color:'#fff'
      },
//    toolbox: {//右侧下载、数据源保存图片功能
//      show: true,
//      orient: 'vertical',
//      left: 'right',
//      top: 'center',
//      feature: {
//        dataView: { readOnly: false },
//        restore: {},
//        saveAsImage: {}
//      }
//    },
//    visualMap: {//左侧数据
//      min: 800,
//      max: 50000,
//      text: ['最高', '最低'],
//      realtime: false,
//      calculable: false,
//      inRange: {
//        color: ['lightskyblue', 'yellow', 'orangered']
//      }
//    },
		geo: [
          // 底层 不包含子区域的地图,除了渐变色应该也能引入图片背景,还没有试过
          {
//        	zlevel: 1,//geo显示级别,默认是0
            map: "shanxi",
            zoom:1.03,
            roam: false,
            itemStyle: {
            	normal: {
            		label:{show:true},
                  areaColor: 'RGBA(189, 26, 26, 0.8)',
                  borderWidth:1,
                  borderColor: 'RGBA(189, 26, 26, 0.8)',
                  shadowBlur: 10,
                  shadowColor: "RGBA(189, 26, 26, 0.8)",
//				areaColor: {
//                type: "pattern",
//                image: domImg, //配置图片
//                repeat: "repeat", //可选值repeat、no-repeat、repeat-x、repeat-y
//              },
               },
//            normal: {
//              areaColor: {
              	borderWidth: 1,
                borderColor: '#fff',
//                //地图色
//                type: "linear",
//                x: 0,
//                y: 1,
//                x2: 0,
//                y2: 0,
//                colorStops: [
//                  {
//                    offset: 1,
//                    color: "RGBA(0, 0, 0, 0.5)", // 0% 处的颜色
//                  },
//                  {
//                    offset: 0,
//                    color: "RGBA(189, 26, 26, 0.8)", // 100% 处的颜色
//                  },
//                ],
//                global: true, // 缺省为 false
//              },
//              shadowColor: "RGBA(189, 26, 26, 0.8)",
//              shadowOffsetX: 2,
//              shadowOffsetY:0,
//              borderColor: "RGBA(189, 26, 26, 0.8)",
//              borderWidth: 1,
//            },
//            emphasis: {//鼠标划过区块的颜色
//                areaColor: "RGBA(189, 26, 26, 0.8)"
//              }

//            emphasis: {
//              areaColor: "#2d9eff", //悬浮区背景
//              shadowColor: "rgba(20, 113, 255,1)",
//              shadowOffsetX: -2,
//              shadowOffsetY: 5,
//              shadowBlur: 10,
//            },
            },
//          regions:[
//          	{
//	              	name: '咸阳市', //区块名称
//	              	itemStyle: {
//	                  	normal: {
//	                    	areaColor: '#c20007'
//	                  	}
//	              }
//	            }
//          ]
          },
        ],
      series: [
        {
//        name: '香港18区人口密度',
          	type: 'map',
          	map: 'shanxi',
	        selectedMode:"single", //选择模式,单选,只能选中一个地市
          	label: {
	          	show: true,
	            textStyle: {
	                color: '#fff' // 设置文字颜色为红色
	            }
        	},
          	itemStyle: {
                normal: {// 设置默认区域颜色
                	areaColor: '#bd1a1a',
                	borderWidth:1,
                	borderColor:'#fff'
            	},
            	emphasis: {// 鼠标移上去选中区域的颜色
	                areaColor: '#ff0000',
	                borderColor:'blue',
	                label: {
                        show: true,
                        textStyle: {
                            color: '#fff'
                        }
                    }
	            },

             },
             select: {//这个就是鼠标点击后,地图想要展示的配置
			  disabled: false,//可以被选中
			  itemStyle: {//相关配置项很多,可以参考echarts官网
			    areaColor: "#77e8e4"//选中
			  },
			  label: {
			    show: true,
			    color: '#fff',
			    emphasis: {
			      color: 'white',
			      show: true
			    }
			  },
			},
	        data: [
	            { name: '榆林市', value: 20057.34 },
	            { name: '延安市', value: 15477.48 },
	            { name: '铜川市', value: 31686.1 },
	            { name: '咸阳市', value: 6992.6 },
	            { name: '渭南市', value: 44045.49 },
	            { name: '宝鸡市', value: 40689.64 },
	            { name: '西安市', value: 37659.78 },
	            { name: '汉中市', value: 45180.97 },
	            { name: '商洛市', value: 55204.26 },
	            { name: '安康市', value: 21900.9 },
	        ],
          // 自定义名称映射
//        nameMap: {
//          'Central and Western': '中西区',
//          Eastern: '东区',
//          Islands: '离岛',
//          'Kowloon City': '九龙城',
//          'Kwai Tsing': '葵青',
//          'Kwun Tong': '观塘',
//          North: '北区',
//          'Sai Kung': '西贡',
//          'Sha Tin': '沙田',
//          'Sham Shui Po': '深水埗',
//          Southern: '南区',
//          'Tai Po': '大埔',
//          'Tsuen Wan': '荃湾',
//          'Tuen Mun': '屯门',
//          'Wan Chai': '湾仔',
//          'Wong Tai Sin': '黄大仙',
//          'Yau Tsim Mong': '油尖旺',
//          'Yuen Long': '元朗'
//        }
        }
      ]
    })
  );
});

myChart.on('click',function(e){
	console.log('sss',e.data)
})

    if (option && typeof option === 'object') {
      myChart.setOption(option);
    }

    window.addEventListener('resize', myChart.resize);
  </script>


 5102
5102


 被折叠的 条评论
为什么被折叠?
被折叠的 条评论
为什么被折叠?
 到【灌水乐园】发言


