


一、简介
Prometheus Server
- Prometheus组件中的核心部分,收集和存储时间序列数据,提供PromQL查询语言的支持。内置的 Express Browser UI,通过这个 UI 可以直接通过 PromQL 实现数据的查询以及可视化。
Exporters
- 将监控数据采集的端点通过HTTP服务的形式暴露给Prometheus Server,Prometheus Server通过访问该Exporter提供的Endpoint端点,即可以获取到需要采集的监控数据
PushGateway
- 主要是实现接收由 Client push 过来的指标数据,在指定的时间间隔,由主程序来抓取。由于 Prometheus 数据采集基于 Pull 模型进行设计,因此在网络环境的配置上必须要让 Prometheus Server 能够直接与 Exporter 进行通信。当这种网络需求无法直接满足时,就可以利用 PushGateway 来进行中转。可以通过 PushGateway 将内部网络的监控数据主动 Push 到 Gateway 当中。而 Prometheus Server 则可以采用同样 Pull 的方式从 PushGateway 中获取到监控数据。
Alertmanager
- 管理告警,主要是负责实现报警功能。在 Prometheus Server 中支持基于 PromQL 创建告警规则,如果满足PromQL定义的规则,则会产生一条告警,而告警的后续处理流程则由 AlertManager 进行管理。在 AlertManager 中我们可以与邮件,Slack 等等内置的通知方式进行集成,也可以通过 Webhook 自定义告警处理方式。AlertManager 即 Prometheus 体系中的告警处理中心。
二、安装
一、Prometheus安装
##下载
wget https://github.com/prometheus/prometheus/releases/download/v2.54.1/prometheus-2.54.1.linux-amd64.tar.gz
##解压
tar vxf prometheus-2.54.1.linux-amd64.tar.gz
##移动
mv prometheus-2.54.1.linux-amd64 prometheus
mv prometheus /portal/monitor/
##添加prometheus用户
useradd -M -s /usr/sbin/nologin prometheus
##查看用户
id prometheus
##赋权限
chown prometheus:prometheus -R /portal/monitor/prometheus

##配置systemd

cat > /etc/systemd/system/prometheus.service << "EOF"
[Unit]
Description=Prometheus
Wants=network-online.target
After=network-online.target

[Service]
Type=simple
User=prometheus
Group=prometheus
Restart=on-failure
ExecStart=/portal/monitor/prometheus/prometheus/prometheus \
  --config.file=/portal/monitor/prometheus/prometheus/prometheus.yml \
  --storage.tsdb.path=/portal/monitor/prometheus/prometheus/data \
  --storage.tsdb.retention.time=60d \
  --web.enable-lifecycle

[Install]
WantedBy=multi-user.target
EOF

##启动
systemctl start prometheus二、alertmanager安装
##下载
wget https://github.com/prometheus/alertmanager/releases/download/v0.27.0/alertmanager-0.27.0.linux-amd64.tar.gz
##解压
tar zxvf alertmanager-0.27.0.linux-amd64.tar.gz
##移动
mv alertmanager-0.27.0.linux-amd64 alertmanager
mv alertmanager /portal/monitor/
##赋权限
chown -R prometheus:prometheus /portal/monitor/


##配置systemd

cat > /etc/systemd/system/alertmanager.service << "EOF"
[Unit]
Description=Alert Manager
Wants=network-online.target
After=network-online.target

[Service]
Type=simple
User=prometheus
Group=prometheus
ExecStart=/portal/monitor/alertmanager/alertmanager \
  --config.file=/portal/monitor/alertmanager/alertmanager.yml \
  --storage.path=/portal/monitor/alertmanager/data
  --web.listen-address=":9190"

Restart=always

[Install]
WantedBy=multi-user.target
EOF
systemctl daemon-reload
修改prometheus配置
# my global config
global:
  scrape_interval: 15s # Set the scrape interval to every 15 seconds. Default is every 1 minute.
  evaluation_interval: 15s # Evaluate rules every 15 seconds. The default is every 1 minute.
  # scrape_timeout is set to the global default (10s).

# Alertmanager configuration
alerting:
  alertmanagers:
    - static_configs:
        - targets:
           - localhost:9193

# Load rules once and periodically evaluate them according to the global 'evaluation_interval'.
rule_files:
    - "alert.yml"
  # - "first_rules.yml"
  # - "second_rules.yml"

# A scrape configuration containing exactly one endpoint to scrape:
# Here it's Prometheus itself.
scrape_configs:
  # The job name is added as a label `job=<job_name>` to any timeseries scraped from this config.
  - job_name: "prometheus"

    # metrics_path defaults to '/metrics'
    # scheme defaults to 'http'.

    static_configs:
      - targets: ["localhost:9090"]
添加告警文件
cat > /portal/monitor/prometheus/alert.yml << "EOF"
groups:
- name: Prometheus alert
  rules:
  # 对任何实例超过30s无法联系的情况发出警告
  - alert: 服务告警
    expr: up == 0
    for: 30s
    labels:
      severity: critical
    annotations:
      instance: "{{ $labels.instance}}"
      description: "{{ $labels.job}} 服务已关闭"

EOF
检查文件是否可用
./promtool check config prometheus.yml 之前配置的热加载,可以使用curl命令
--web.enable-lifecycle

curl -X POST http://localhost:9090/-/reload三、Grafana安装
##下载
wget https://dl.grafana.com/enterprise/release/grafana-enterprise-11.2.0.linux-amd64.tar.gz
##解压
tar zxvf grafana-enterprise-11.2.0.linux-amd64.tar.gz
##移动
mv grafana-v11.2.0 grafana
mv grafana /portal/monitor/
##赋权限
chown prometheus:prometheus -R /portal/monitor/


##配置文件

cat > /etc/systemd/system/grafana-server.service << "EOF"
[Unit]
Description=Grafana server
Documentation=http://docs.grafana.org

[Service]
Type=simple
User=prometheus
Group=prometheus
ExecStart=/portal/monitor/grafana/bin/grafana-server \
  --config=/portal/monitor/grafana/conf/defaults.ini \
  --homepath=/portal/monitor/grafana

[Install]
WantedBy=multi-user.target
EOF

##重载配置
systemctl daemon-reload
##启动
systemctl start granfa-server
访问
四、node_exporter安装
##下载
wget https://github.com/prometheus/node_exporter/releases/download/v1.8.2/node_exporter-1.8.2.linux-amd64.tar.gz
##压缩
tar zxvf node_exporter-1.8.2.linux-amd64.tar.gz
##移动
mv node_exporter-1.8.2.linux-amd64 node_exporter
mv node_exporter /portal/monitor/
##赋权
chown -R prometheus:prometheus /portal/monitor


##配置文件
cat > /etc/systemd/system/node_exporter.service << "EOF"
[Unit]
Description=node_exporter
Documentation=http://prometheus.io/
After=network.target
[Service]
User=prometheus
Group=prometheus
ExecStart=/portal/monitor/node_exporter/node_exporter
Restart=on-failure

[Install]
WantedBy=multi-user.target
EOF

##重载
systemctl daemon-reload
##启动
systemctl start node_exporter
systemctl status node_exporter

##开机启动
systemctl enable node_exporter
systemctl enable grafana-server
systemctl enable alertmanager
systemctl enable prometheus
五、Grafana面板配置
1、登录 admin/admin
2、添加数据源
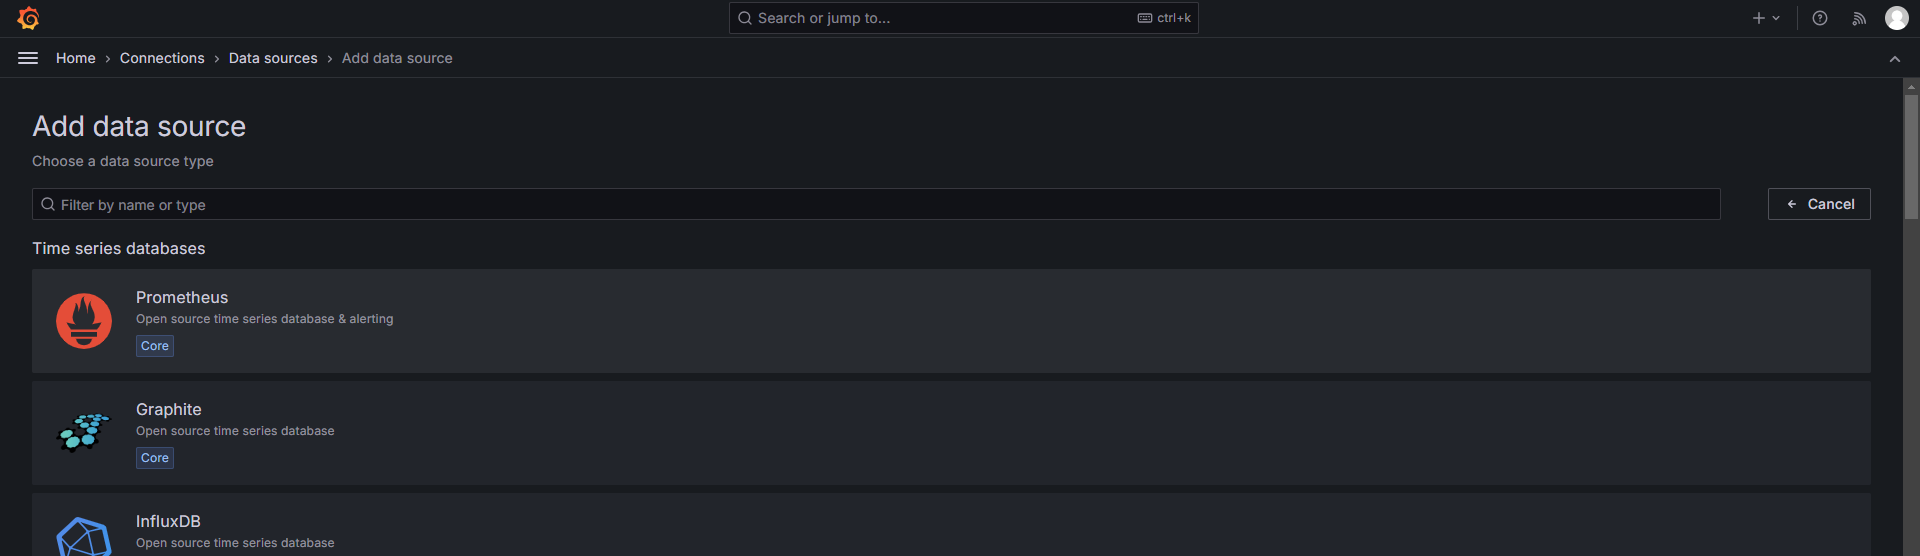
3、导入模板
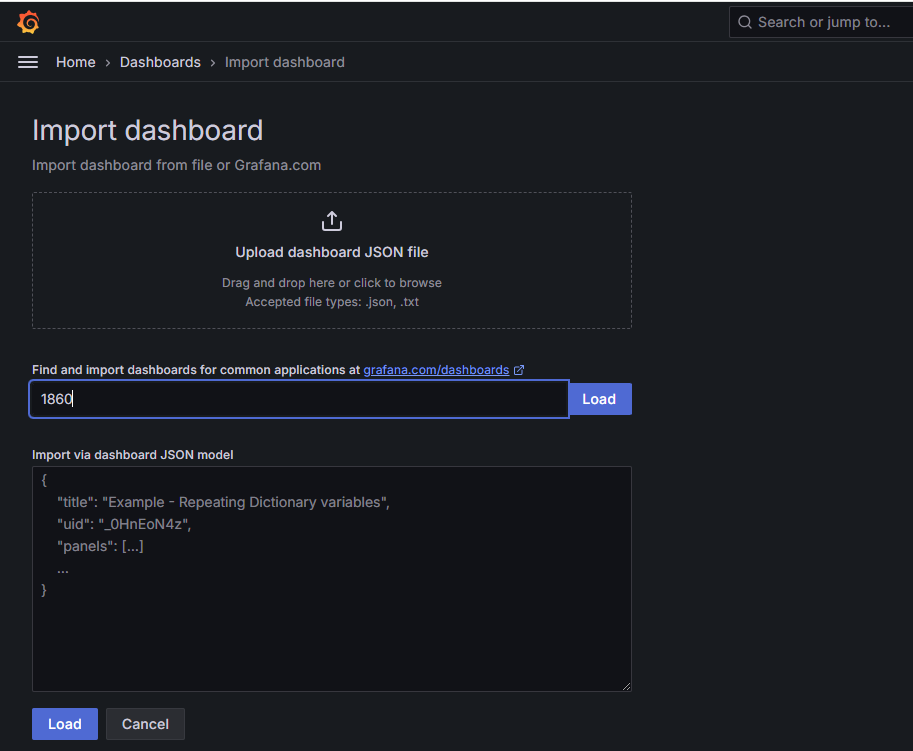
4、服务器监控


 2685
2685

 被折叠的 条评论
为什么被折叠?
被折叠的 条评论
为什么被折叠?
 到【灌水乐园】发言


