


System Performance: Enterprise and the Cloud, 2nd Edition (2020)》阅读笔记简要记录
6. CPU
6.3 概念
6.3.1 时钟频率clock rate
时钟是一个驱动所有处理器逻辑的数字信号,每个CPU指令都可能花费一个或多个时钟周期(称为CPU周期)来执行。例如一个4GHz的CPU每秒运行40亿个时钟周期。
6.3.2 指令instructions
一个指令包括以下步骤,每个步骤都由CPU中的功能单元(functional unit)处理:
- instruction fetch 指令预取
- instruction decode 指令解码
- excute 执行
- memory access 内存访问
- register write-back 寄存次回写
最后两步是可选的,许多指令只操作寄存器并不需要访问内存。
每个步骤都需要至少一个clock cycle时钟周期来执行。内存访问经常是最慢的,因为它通常需要几十个时钟周期读或写主存,在此期间指令执行陷入停滞,这些周期叫stall cycles(停滞周期),CPU缓存存在的必要性:它极大降低内存访问需要的周期数。
6.3.3 指令流水线instruction pipeline
指令流水线通过同时执行不同指令的不同部分来提供效率。
branch prediction
分支预测。
Modern processors can perform out-of-order execution of the pipeline, where later instructions
can be completed while earlier instructions are stalled, improving instruction throughput. However, conditional branch instructions(条件分支指令) pose a problem. Branch instructions jump execution to a different instruction, and conditional branches do so based on a test. With conditional branches, the processor does not know what the later instructions will be. As an optimization, processors often implement branch prediction, where they will guess the outcome of the test and begin processing the outcome instructions. If the guess later proves to be wrong, the progress in the instruction pipeline must be discarded, hurting performance.
6.3.4 指令宽度instruction width
同一种类型的functional unit(功能单元)可以有好几个,这样每个时钟周期里可以处理更多的指令。这种CPU架构称为superscalar(超标量),通常和pipeline(流水线)一起使用提高指令吞吐量。
instruction width(指令宽度)是指同时处理的目标指令数量。现代处理器一般宽度为3或者4,意味着每个clock cycle里最多完成3~4个指令。当然如何执行取决于处理器本身, 不同环节有不同数量的功能单元处理指令。
6.3.5 指令长度instruction size
对于处理器而言,指令长度可变的。比如x86,复杂指令集(complex instruction set computer,CISC),最大允许15Bytes的指令长度;ARM,精简指令集(reduced instruction set computer,RISC),在4字节对齐的AArch32/A32处理器上指令长度是4Bytes,ARM Thumb指令集中则是2-4字节。
6.3.6 SMT
simultaneous multiprocessing(同步多线程),利用超标量架构和硬件多线程技术来达到一个时钟周期里在单个CPU上同时处理多个线程的指令。
实例:intel超线程技术,通常一个核上支持2个硬件线程;POWER8,一个核上支持8个硬件线程。
每个硬件线程的性能与单独的CPU内核不同,并且取决于在工作量上。 为了避免性能问题,内核可能会将CPU负载分散到各个内核中这样每个内核上只有一个硬件线程处于繁忙状态,从而避免了硬件线程争用。停滞周期繁重(低IPC)的工作负载也可能比那些工作负载具有更好的性能。指令繁重(高IPC),因为停顿周期减少了核心竞争。
6.3.7 IPC,CPI
instructions per cycle,IPC,每周期指令数。衡量CPU使用率的一个很重要的高级指标。
cycles per instruction,CPI,每指令周期数,IPC的倒数。IPC经常用于Linux社区以及perf分析中,CPI通常被intel及其他地方所用。
低IPC意味着CPU经常陷入停滞,通常是在访问内存。
内存访问密集的负载,可以通过使用更快的内存(DRAM)来提高性能、提高内存本地行(软件配置)或者减少内存I/O数量。即使使用更高频率的CPU可能并不能达到提升预期的性能目标,因为CPU还是要等待内存I/O完成而花费同样的时间,更快的CPU意味着更多的停滞周期,而指令完成速率不变。
IPC只是代表指令处理的效率,不是指令本身的效率。
6.3.8 使用率
CPU使用率是指一段时间内CPU实例忙于工作的时间比例百分比。
如何计算?一段时间内CPU未运行内核idle线程,在运行其他比如用户应用线程、其他内核线程、处理中断等。
6.3.9 用户时间、内核时间
CPU花在执行用户态应用程序的代码称为用户时间,执行内核态代码的时间称为内核时间。
6.3.10 饱和度saturation
一个利用率100%的CPU是饱和的,这种情况下,线程需要被延时调度去等待CPU,降低了总体性能。
6.3.11 preemption抢占
更高优先级的线程可以抢占CPU。
6.3.12 优先级反转priority inversion
这是指低优先级的线程占有某个资源,反而阻塞了高优先级线程,这影响了高优先级任务的性能。
这怎么解决:

linux自2.6.18起提供了一个用户态的mutex支持优先级继承,用于实时负载。
6.3.13 多进程和多线程

6.3.14 字长work size
6.3.15 编译器优化
6.4 CPU架构
这里主要简要介绍和性能相关的架构概念,详细的CPU架构需要参考专业的书籍。
6.4.1 硬件
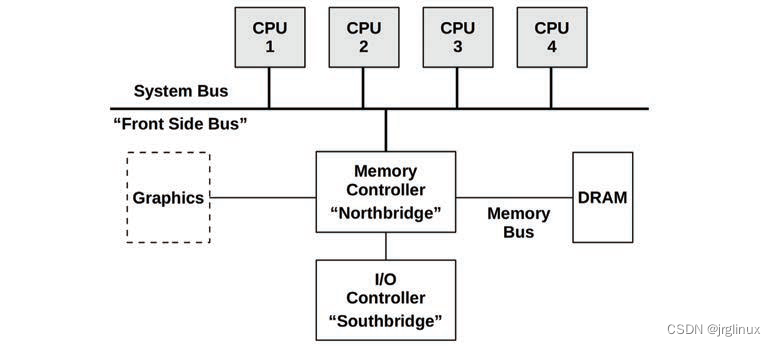
CPU硬件包括了处理器及其子系统subsystems,以及多处理器的CPU之间的互联。
**处理器:**如下图所示典型的双核处理器架构图
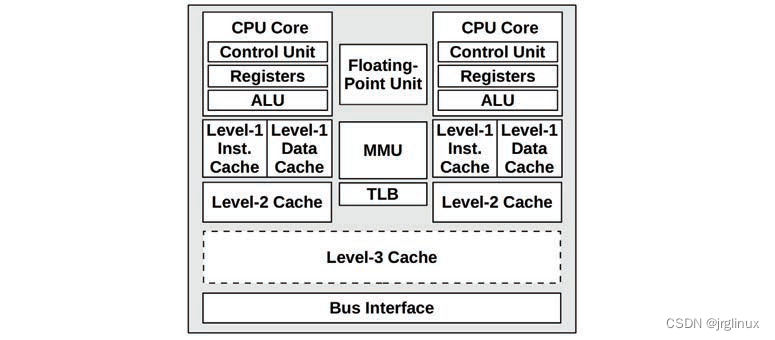
control unit 控制单元,CPU核的核心功能,包含指令预取、解码、管理执行以及结果存储等。
其他和性能有关的组件有:
- P-cache: Prefetch cache (per CPU core) 预取缓存
- W-cache: Write cache (per CPU core) 写缓存
- Clock: Signal generator for the CPU clock (or provided externally) 时钟
- Timestamp counter: For high-resolution time, incremented by the clock 时间戳计数器
- Microcode ROM: Quickly converts instructions to circuit signals 微代码ROM
- Temperature sensors: For thermal monitoring 温度传感器
- Network interfaces: If present on-chip (for high performance) 网络接口
P-States and C-States
The advanced configuration and power interface (ACPI) standard,英特尔处理器在使用,定了processor performance states(P-states)和processor power states (C-states)。
| P-states | |
|---|---|
| P0 | highest frequency states,部分英特尔CPU叫turbo bosst等级 |
| P1 | lower frequence states |
| … | |
| PN |
P-states可以通过硬件(如处理器温度)或者软件(如内核省电模块)等来改变。通过MSRs寄存器可以查看当前状态(showboost(8)工具)。
| C-states | |
|---|---|
| C0 | Executing. The CPU is fully on, processing instructions. |
| C1 | Halts execution. Entered by the hlt instruction. Caches are maintained. Wakeup latency is the lowest from this state |
| C1E | Enhanced halt with lower power consumption (supported by some processors). |
| C2 | Halts execution. Entered by a hardware signal. This is a deeper sleep state with higher wakeup latency |
| C3 | A deeper sleep state with improved power savings over C1 and C2. The caches may maintain state, but stop snooping (cache coherency), deferring it to the OS. |
CPU caches
有片上(on-chip)、模上(on-die)、嵌入式(embedded)、集成(integrated)、外部(external)缓存
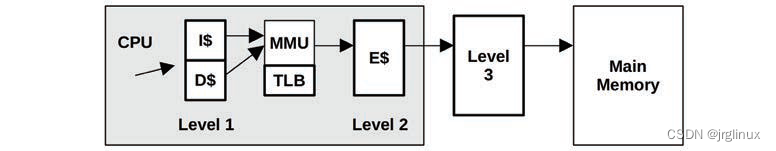
- Level 1 instruction cache (I$) 一级指令缓存
- Level 1 data cache (D$) 一级数据缓存
- Translation lookaside buffer (TLB) 转译后备缓冲器
- Level 2 cache (E$) 二级缓存
- Level 3 cache (optional) 三级缓存(可选)
Intel通常把main memory之前的最后一级缓存叫做last-level cache(LLC)(可能是L3 cache也可能不是),也叫做longest-latency cache。
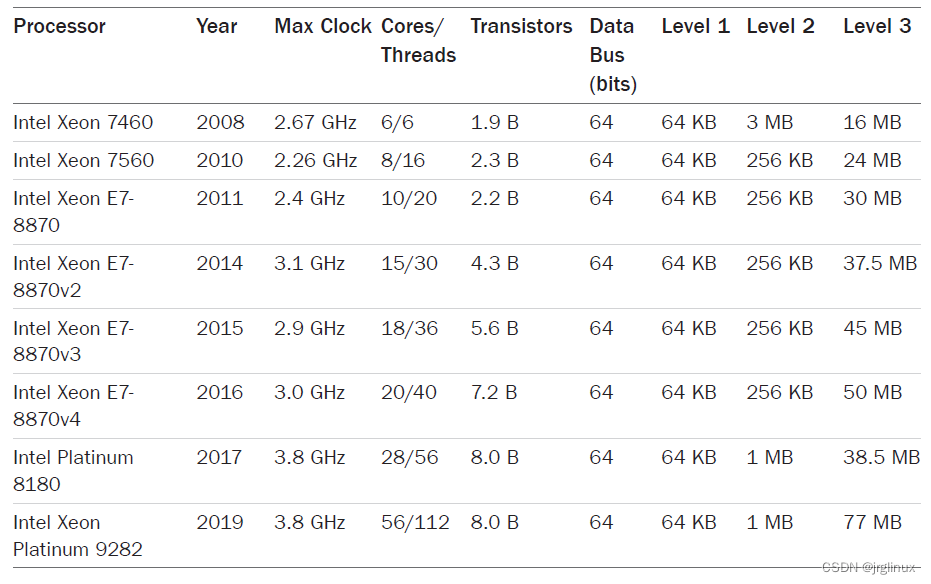
For multicore and multithreading processors, some caches may be shared between cores and threads. For the examples in Table 6.3, all processors since the Intel Xeon 7460 (2008) have multiple Level 1 and Level 2 caches, typically one for each core (the sizes in the table refer to the per-core cache, not the total size).
latency延时
The access time for the Level 1 cache is typically a few CPU clock cycles, and for the larger Level 2 cache around a dozen clock cycles. Main memory access can take around 60 ns (around 240 cycles for a 4 GHz processor), and address translation by the MMU also adds latency.

该图是用benchmark工具plot出来的,表示了每一级缓存满了的情况下,延时的递增。
associativity相联性
相联性是定位缓存新条目范围的一种缓存特性,类型如下:
- 全关联:缓存可以在任意位置放置新条目。比如LRU算法可以剔除缓存中最老的项目。
- 直接映射:每个条目在缓存里只有一个有效的地方
- 组关联:通过映射(如哈希)定位缓存中的一组地址,再对这些使用另一个算法(如LRU)。
缓存行cache line
This is a range of bytes that are stored and transferred as a unit, 提高内存吞吐量。x86处理器典型的缓存行大小为64字节。
缓存一致性cache coherency
内存可能会同时被缓存在不同处理器的多个CPU里,当一个CPU修改了内存,所有的缓存需要知道他们的缓存拷贝已经失效,应该被丢弃,这样后续读才会取到新修改的拷贝,这个过程叫做缓存一致性,确保了CPU永远访问正确的内存状态,这也是设计可扩展多处理器系统的最大挑战之一,因为内存会被频繁修改。
One of the effects of cache coherency is LLC access penalties. The following examples are provided as a rough guide :
- LLC hit, line unshared: ~40 CPU cycles
- LLC hit, line shared in another core: ~65 CPU cycles
- LLC hit, line modified in another core: ~75 CPU cycles
MMU
memory management unit内存管理单元,负责虚拟内存到物理内存的映射转换。
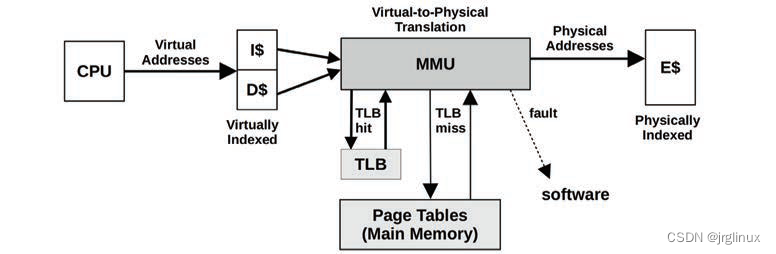
上图中,MMU利用片上转译后备缓冲区(TLB)来进行缓存地址转换,如果缓存未命中,则有主存(DRAM)中页面(page tables)来处理,页面是由内核维护并通过MMU硬件直接读取。
TLB的百度百科解释:
转译后备缓冲器,也被翻译为页表缓存、转址旁路缓存,为CPU的一种缓存,由存储器管理单元用于改进虚拟地址到物理地址的转译速度。当前所有的桌面型及服务器型处理器(如 x86)皆使用TLB。TLB具有固定数目的空槽,用于存放将虚拟地址映射至物理地址的标签页表条目。为典型的结合存储(content-addressable memory,首字母缩略字:CAM)。其搜索关键字为虚拟内存地址,其搜索结果为物理地址。如果请求的虚拟地址在TLB中存在,CAM 将给出一个非常快速的匹配结果,之后就可以使用得到的物理地址访问存储器。如果请求的虚拟地址不在TLB 中,就会使用标签页表进行虚实地址转换,而标签页表的访问速度比TLB慢很多。有些系统允许标签页表被交换到次级存储器,那么虚实地址转换可能要花非常长的时间。
互联interconnects
多处理器架构中,处理器通过共享系统总线或者专用互联连接起来。这与系统的内存架构有关系,如统一内存访问(UMA)和非一致内存访问(NUMA)。
Hardware Counters(PMCs)
Performance monitoring counters是观察统计资源的统称。
PMCs:是可以通过编程来记录低级CPU活动的硬件寄存器,通常包含以下计数器:
| 计数器 | |
|---|---|
| CPU cycles | 停滞周期和停滞周期的类型 |
| CPU指令 | 引退的(执行过的) |
| L1/L2/L3缓存访问 | 命中(Hits)、未命中(Misses) |
| floating-point unit浮点单元 | 操作 |
| 内存I/O | 读、写、阻塞周期 |
| 资源I/O | 读、写、阻塞周期 |
通常每个CPU有2-8个可供编程来记录这些事件的寄存器。
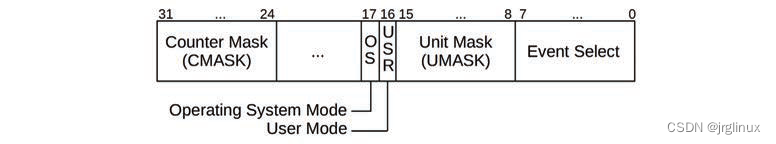
以Intel P6家族为例:
该类型处理器提供4个型号特定寄存器(mode-specific register,MSR)来提供性能寄存器,2个MSRs是只读计数器;另外2个MSRs用来对计数器counter编程,可读可写,称为事件选择MSRs(event-select MSRs)。performance counters是40位寄存器,而event-select MSRs是32位寄存器,下图是event-select MSR的格式图。
6.4.2 软件
支撑CPUs的内核软件包括:调度器scheduler、调度类scheduling classes、空闲线程idle thread。
scheduler


调度器功能:
| time sharing 分时 | 可运行线程之间的多任务,优先执行最高优先级任务 |
| preemption 抢占 | 一旦有高优先级线程变为可运行状态,调度器能够抢占当前运行的线程,执行较高优先级的线程 |
| load balancing 负载均衡 | 把可运行的线程移到空闲或者较为不繁忙的CPU runqueue中去 |
图中的run queue是组织等待执行的任务(waiting tasks),Linux的CFS调度器使用红黑树来组织管理。
Linux调度器:
| 函数名 | 作用 |
|---|---|
| scheduler_tick() | 系统定时器中断调用该函数来触发time sharing(分时),调度器会根据时间片(time slices)和优先级(priorities)来调度 |
| check_preepmt_curr() | 触发preemption(抢占) |
| __schedule() | 线程切换管理 |
| pick_next_task() | 线程切换时选择高优先级的线程 |
| load_balance() | 负载均衡 |
| idle_balance() | 平衡线程迁移,迁移的损耗大于益处时,调度器会平衡,维持线程在同一个CPU上运行 |
| task_hot() | CPU caches warm(CPU affinity),CPU亲和度 |
scheduling classes
调度类用于管理可运行线程的行为,尤其是它们的优先级、时间片是否结束、时间片的长度等等。通过调度策略也可施加其他的控制,比如同一个优先级线程间的调度。
下图是Linux中优先级,数值越小优先级越高。
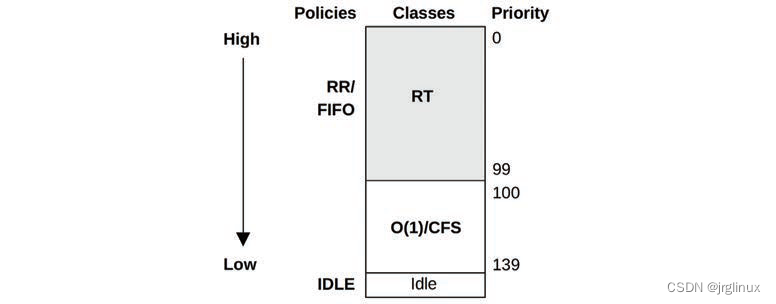
Linux中的nice值设置了线程的静态优先级static priority,和这里调度器计算的dynamic priority有区别。
Linux中的调度类:
| scheduling classes | |
|---|---|
| RT | 为实时负载提供固定的高优先级。内核支持用户级和内核级的抢占,允许RT任务以低延时被分发,优先级范围是0-99 |
| O(1) | O(1)调度器是linux2.6引进,比原来的O(n)性能高,动态的将I/O密集型任务的优先级比CPU密集型的任务优先级提高,对交互性任务和I/O负载来说延时更小 |
| CFS | completly fair scheduling,完全公平调度,linux2.6.23引入,利用红黑树管理任务而不是过去的run queue |
| Idle | Runs threads with the lowest possible priority |
| Deadline | Added to Linux 3.14, applies earliest deadline first (EDF) scheduling using three parameters: runtime, period, and deadline. |
To select a scheduling class, user-level processes select a scheduling policy that maps to a class, using either the sched_setscheduler(2) syscall or the chrt(1) tool.
调度策略:
| scheduler policies | 使用的scheduling classes | |
|---|---|---|
| RR | SCHED_RR is round-robin scheduling(轮转调度策略),一旦时间片用完,它就被移到它坐在优先级的run queue末尾,让其他同优先级的线程去运行,使用RT scheduling class | RT |
| FIFO | SCHED_FIFO is first-in, first-out scheduling(先进先出调度),一直运行队列头部的线程直到它资源退出,或者一个更高优先级的线程抵达。线程会一直运行,即便在运行队列的当中存在相同优先级的其他线程 | RT |
| NORMAL | SCHED_NORMAL (previously known as SCHED_OTHER) is time-sharing scheduling and is the default for user processes(分时调度,用户进程的默认策略)。调度器根据调度类动态调整优先级。对于O(1),时间片长度根据静态优先级设置,即更高优先级的工作分配到更长的时间。对于CFS,时间片是动态的 | CFS |
| BATCH | SCHED_BATCH类似于SCHED_NORMAL,但期望是CPU密集型线程,并且不会被调度去中断其他I/O密集型线程 | CFS |
| IDLE | SCHED_IDLE uses the Idle scheduling class | idle |
| DEADLINE | SCHED_DEADLINE uses the Deadline scheduling class | Deadline |
When there is no thread to run, a special idle task (also called idle thread) is executed as a placeholder until another thread is runnable.(当没有可运行的线程时,会运行idle线程空闲线程)
idle thread
the kernel “idle” thread (or idle task) runs on-CPU when there is no other runnable thread and has the lowest possible priority. It is usually programmed to inform the processor that CPU execution may either be halted (halt instruction) or throttled down to conserve power. The CPU will wake up on the next hardware interrupt.
NUMA Grouping
Performance on NUMA systems can be significantly improved by making the kernel NUMA-aware, so that it can make better scheduling and memory placement decisions.
Processor resource-ware
The CPU resource topology can also be understood by the kernel so that it can make better
scheduling decisions for power management, hardware cache usage, and load balancing.
6.5 方法
6.5.1 工具
| uptime | |
| vmstat | |
| mpstat | |
| top | |
| pidstat | |
| perf/profile | |
| perf | |
| showboost/turboboost | |
| dmesg |
6.5.2 USE方法
USE:utilization、saturation、errors
6.5.3 负责特征归纳workload characterization
CPU负载特征归纳的基本属性:
| 平均负载 | CPU load averages(utilization + saturation) |
| 用户时间与系统时间之比 | user-time to system-time ratio |
| 系统调用评率 | syscall rate |
| 自愿上下文切换评率 | voluntary context switch rate |
| 中断评率 | interrupt rate |
6.5.4 剖析法profiling
一般分两种方法:
| timer-based sampling | 采集当前正在运行的函数或栈的基于时间的样点。 通常用99Hz/CPU的频率采样,为何不用100Hz(100Hz容易发生lock-step sampling)。采样对性能是有损耗的,同样是降低时间频率、延长采样时间,这样平均损耗就小 |
| function tracing | 性能的额外开销通常很大,超过10% |
采样例子示意图,按一定频率采样,函数A调用函数B,函数B系统调用陷入内核阻塞,中断唤醒函数B再调用函数C,这期间,函数B阻塞的时候off-CPU没有被采样,函数C太短暂就没被采样。

采样处理sample processing
采样处理也会面临问题:
| storage I/O | 采样量较大时,会产生I/O存储行为,这对原来的系统性能是一种干扰。比如perf record会记录perf.data文件。BPF中的profile(8)工具可以解决该问题(profile将sample保存在kernel memory里) |
| 阅读分析样本 | 样本行量很大时,阅读分析也是一个问题,需要利用flame graph火焰图工具进行分析 |
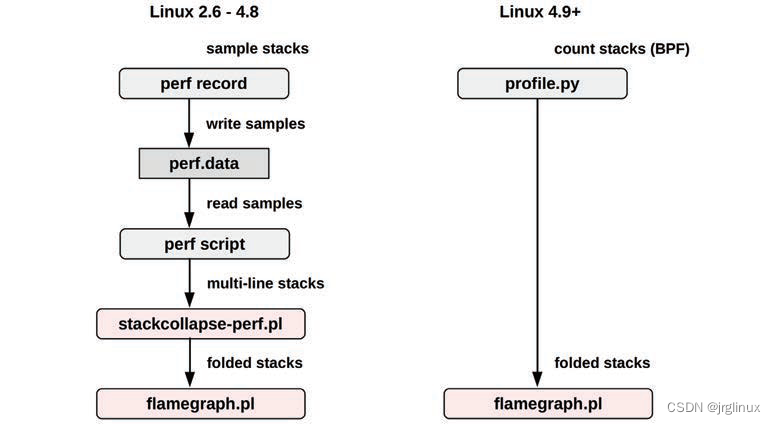
如上图所示,BPF采样对性能额外损耗较小。但是perf(1)采样可以将sample保存后由其他工具进行分析解读,这个是BPF不具备的。
6.5.5 周期分析cycle analysis
分析IPC(CPI)等
6.5.6 性能监控performance monitoring
衡量CPU的指标有:
- 使用率:查看百分比
- 饱和度:查看运行队列长度或者调度延迟
6.6 工具
6.6.1 uptime
uptime查看平均负载
平均负载:只针对可运行状态或者不可被中断状态的进程而言。它的值不是指CPU个数,它代表占比,比如平均负载为1,在一个cpu的系统上表示cpu的100%负载,而在4个cpu的系统上则表示cpu有75%的时间是idle。
System load averages is the average number of processes that are either in a runnable or uninterruptable state
Load averages 的三个值分别代表最近 1/5/15 分钟的平均系统负载。在多核系统中,这些值有可能经常大于1,比如四核系统的 100% 负载为 4,八核系统的 100% 负载为 8。
Loadavg 有它固有的一些缺陷:
- uninterruptible的进程,无法区分它是在等待 CPU 还是 IO。无法精确评估单个资源的竞争程度;
- 最短的时间粒度是 1 分钟,以 5 秒间隔采样。很难精细化管理资源竞争毛刺和短期过度使用;
- 结果以进程数量呈现,还要结合 cpu 数量运算,很难直观判断当前系统资源是否紧张,是否影响任务吞吐量
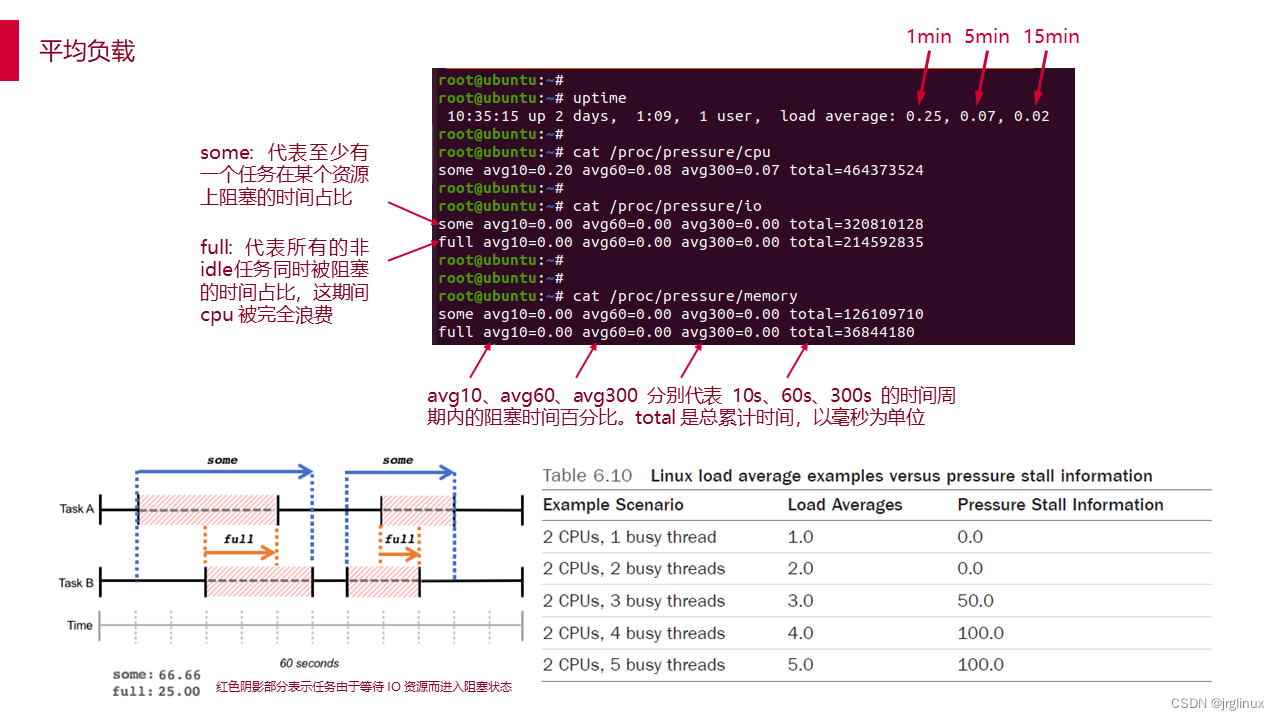
PSI - Pressure Stall Information
每类资源的压力信息都通过 proc 文件系统的独立文件来提供,路径为 /proc/pressure/ – cpu, memory, and io.
其中 CPU 压力信息格式如下:
some avg10=2.98 avg60=2.81 avg300=1.41 total=268109926
memory 和 io 格式如下:
some avg10=0.30 avg60=0.12 avg300=0.02 total=4170757
full avg10=0.12 avg60=0.05 avg300=0.01 total=1856503
avg10、avg60、avg300 分别代表 10s、60s、300s 的时间周期内的阻塞时间百分比。total 是总累计时间,以毫秒为单位。
some 这一行,代表至少有一个任务在某个资源上阻塞的时间占比,full 这一行,代表所有的非idle任务同时被阻塞的时间占比,这期间 cpu 被完全浪费,会带来严重的性能问题。我们以 IO 的 some 和 full 来举例说明,假设在 60 秒的时间段内,系统有两个 task,在 60 秒的周期内的运行情况如下图所示:
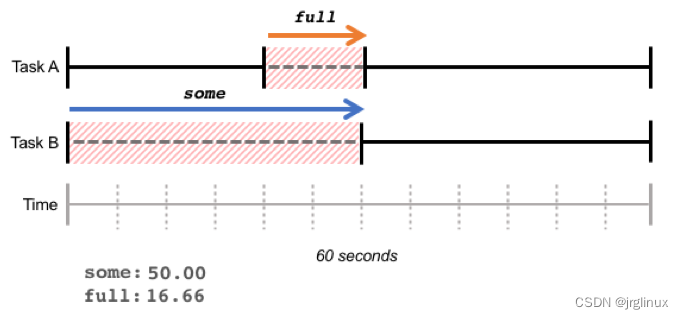
红色阴影部分表示任务由于等待 IO 资源而进入阻塞状态。Task A 和 Task B 同时阻塞的部分为 full,占比 16.66%;至少有一个任务阻塞(仅 Task B 阻塞的部分也计算入内)的部分为 some,占比 50%。
some 和 full 都是在某一时间段内阻塞时间占比的总和,阻塞时间不一定连续,如下图所示:
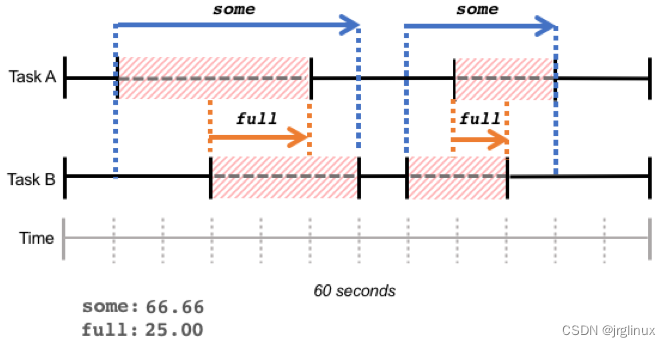
IO 和 memory 都有 some 和 full 两个维度,那是因为的确有可能系统中的所有任务都阻塞在 IO 或者 memory 资源,同时 CPU 进入 idle 状态。
但是 CPU 资源不可能出现这个情况:不可能全部的 runnable 的任务都等待 CPU 资源,至少有一个 runnable 任务会被调度器选中占有 CPU 资源,因此 CPU 资源没有 full 维度的 PSI 信息呈现。
通过这些阻塞占比数据,我们可以看到短期以及中长期一段时间内各种资源的压力情况,可以较精确的确定时延抖动原因,并制定对应的负载管理策略。
6.6.2 vmstat
显示虚拟内存使用情况的工具
用法:
Usage:
 vmstat [options] [delay [count]]

Options:
 -a, --active           active/inactive memory
 -f, --forks            number of forks since boot
 -m, --slabs            slabinfo
 -n, --one-header       do not redisplay header
 -s, --stats            event counter statistics
 -d, --disk             disk statistics
 -D, --disk-sum         summarize disk statistics
 -p, --partition <dev>  partition specific statistics
 -S, --unit <char>      define display unit   #设置显示数值的单位(k,K,m,M)
 -w, --wide             wide output
 -t, --timestamp        show timestamp

 -h, --help     display this help and exit
 -V, --version  output version information and exit

For more details see vmstat(8).
[root@localhost /]# vmstat -Sm 1 2
procs -----------memory---------- ---swap-- -----io---- -system-- ------cpu-----
 r  b   swpd   free   buff  cache   si   so    bi    bo   in   cs us sy id wa st
 3  0   2269  71344    341  56880    0    0    77    48    1    1  4  2 93  1  0
 3  0   2269  71343    341  56880    0    0     0    24 29804 37752  4  2 94  0  0
默认是KiB为单位,可以通过参数-SM来指定以MB为单位显示。
| r | The number of runnable processes (running or waiting for run time). | procs |
| b | The number of processes in uninterruptible sleep. | |
| swpd | the amount of virtual memory used. | memory |
| free | the amount of idle memory. | |
| buff | the amount of memory used as buffers. | |
| cache | the amount of memory used as cache. | |
| active | the amount of active memory. (-a option) | |
| inactive | the amount of inactive memory. (-a option) | |
| si | Amount of memory swapped in from disk (/s). | swap |
| so | Amount of memory swapped to disk (/s). | |
| bi | Blocks received from a block device (blocks/s). | io |
| bo | Blocks sent to a block device (blocks/s). | |
| in | The number of interrupts per second, including the clock. | system |
| cs | The number of context switches per second. | |
| us | Time spent running non-kernel code. (user time, including nice time) | cpu (以下都是占cpu time的百分比值) |
| sy | Time spent running kernel code. (system time) | |
| id | Time spent idle. | |
| wa | Time spent waiting for IO. | |
| st | Time stolen from a virtual machine. | |
6.6.3 mpstat
查看处理器的活动状态,依赖/proc/stat文件
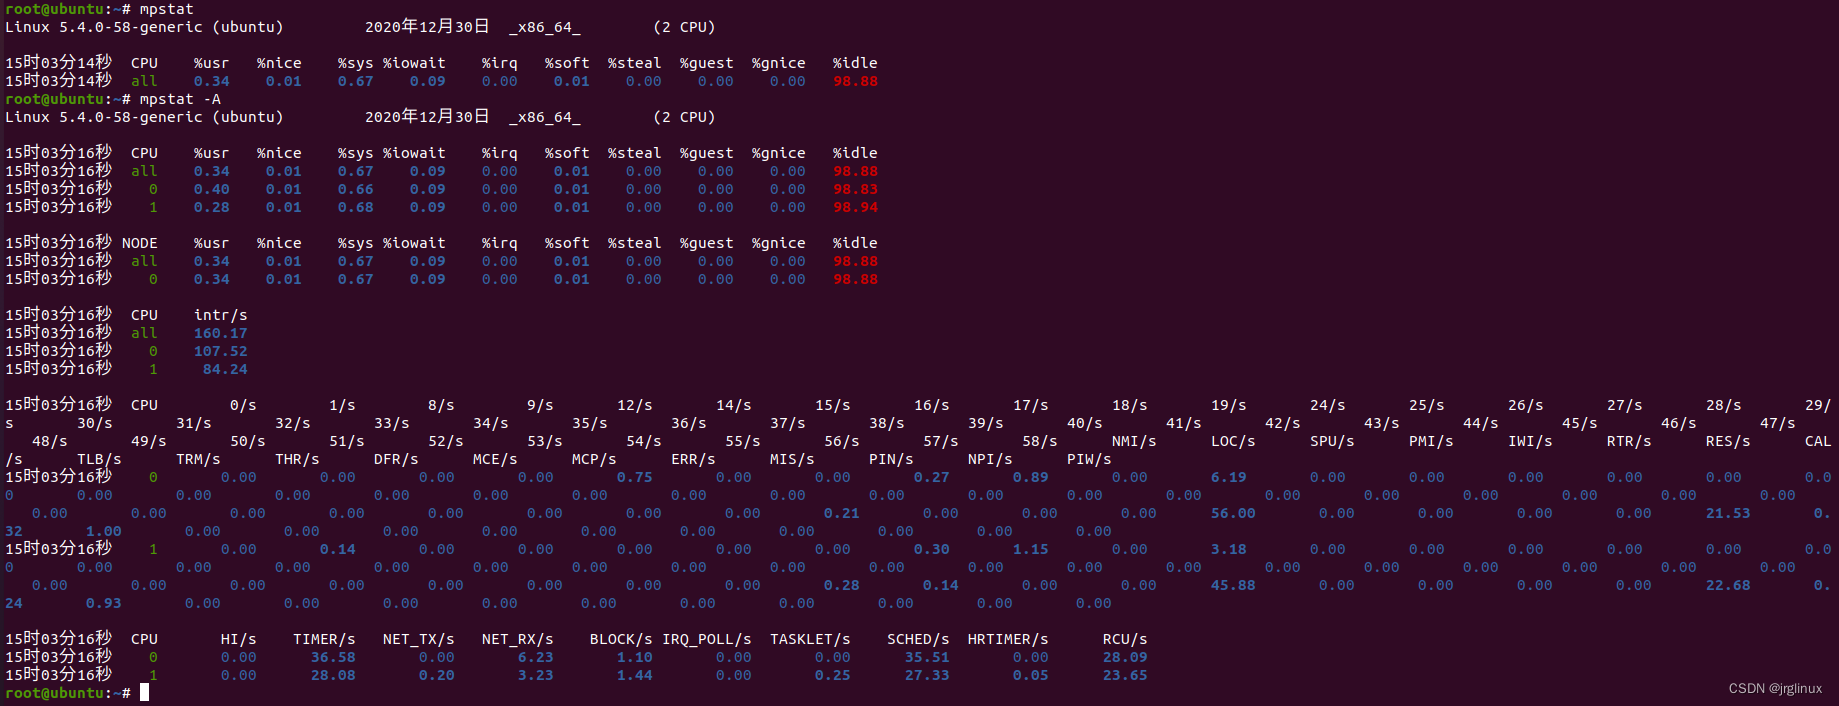
CPU: Processor number. The keyword all indicates that statistics are calculated as averages among all processors.

%usr: Show the percentage of CPU utilization that occurred while executing at the user level (application).

%nice: Show the percentage of CPU utilization that occurred while executing at the user level with nice priority.

%sys: Show  the  percentage  of CPU utilization that occurred while executing at the system level (kernel). Note that this does not include time spent servicing hardware and software interrupts.

%iowait: Show the percentage of time that the CPU or CPUs were idle during which the system had an outstanding disk I/O request.

%irq: Show the percentage of time spent by the CPU or CPUs to service hardware interrupts.

%soft: Show the percentage of time spent by the CPU or CPUs to service software interrupts.

%steal: Show the percentage of time spent in involuntary wait by the virtual CPU or CPUs while the hypervisor was servicing another virtual processor.

%guest: Show the percentage of time spent by the CPU or CPUs to run a virtual processor.

%gnice: Show the percentage of time spent by the CPU or CPUs to run a niced guest.

%idle: Show the percentage of time that the CPU or CPUs were idle and the system did not have an outstanding disk I/O request.


 6161
6161


 被折叠的 条评论
为什么被折叠?
被折叠的 条评论
为什么被折叠?
 到【灌水乐园】发言


