


ELK框架Logstash配合Filebeats和kafka使用
本文目录
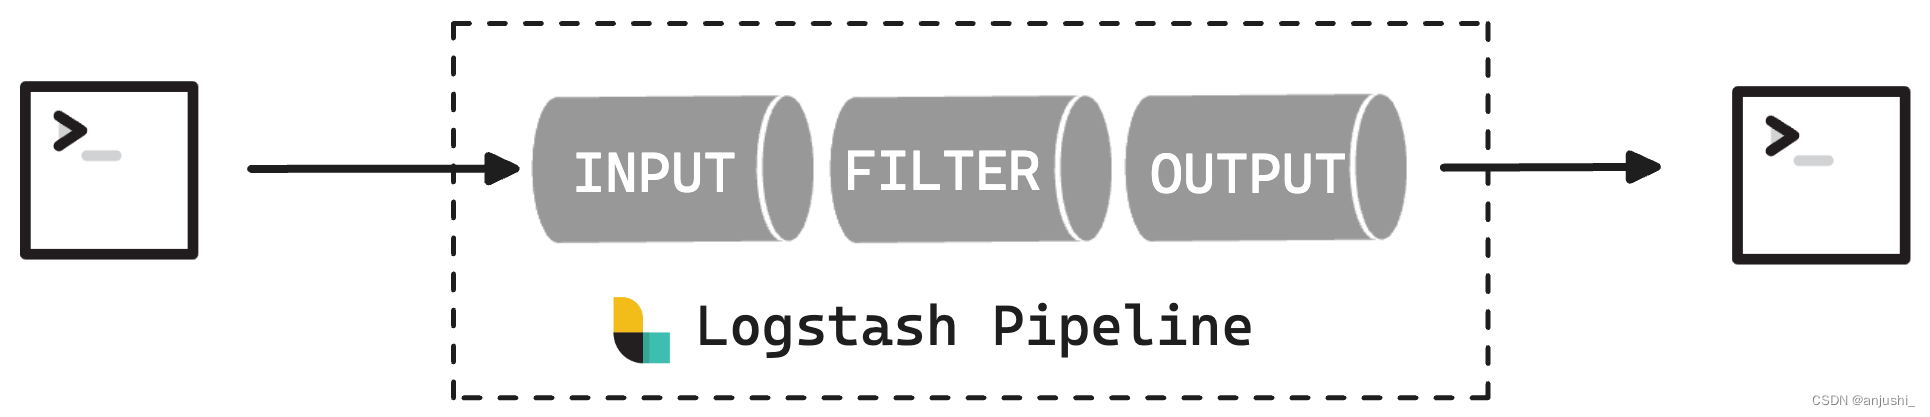
配置文件结构
配置文件为:logstash.yml
需要自己新建conf文件,设置input,filter和output,文件结构如下,自带的logstash-sample.conf内容如下
input {

}
filter {

}
output {

}

启动命令
bin/logstash -f config/logstash.conf
https://www.elastic.co/guide/en/logstash/current/input-plugins.html
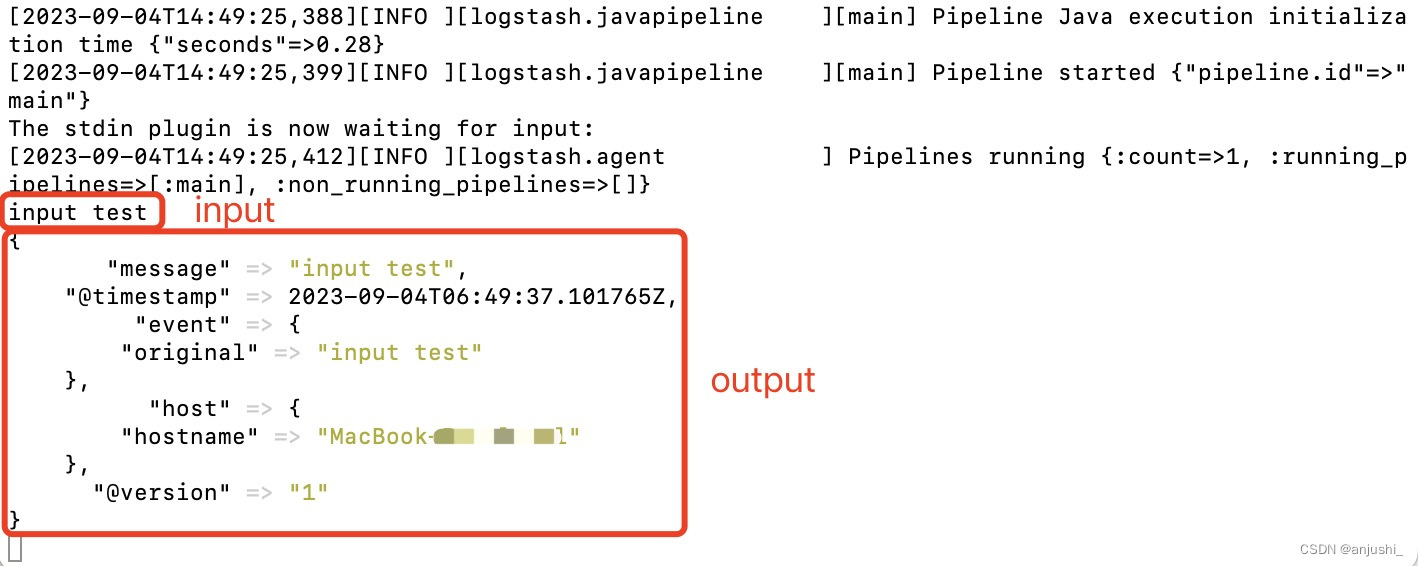
input为标准输入,output为标准输出
input {
  stdin { }
}
output {
  elasticsearch {
    hosts => ["localhost:9200"]
  }
  stdout { }
}
input为log文件
output为标准输出
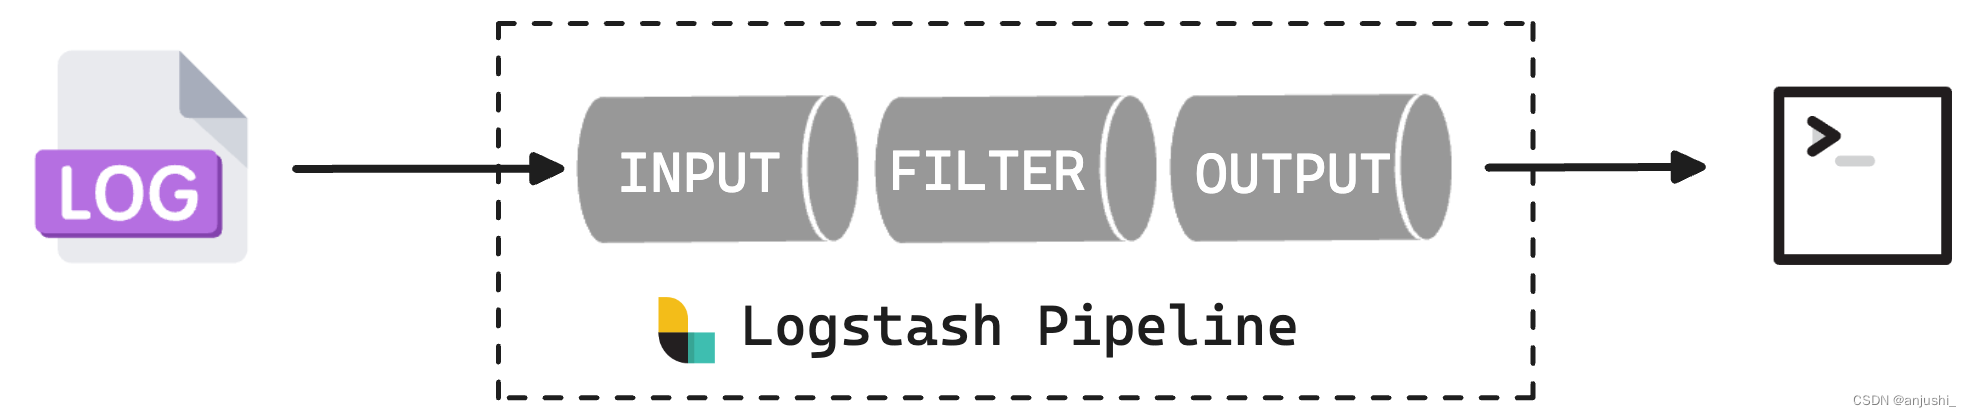
input {
  # 从文件读取日志信息
  file {
    path => "/xxx/demolog/logs/myapp-info.log"
    type => "ghn"
    start_position => "beginning"
  }

}

output {
  stdout { codec => rubydebug }
}

output为es

input {
  # 从文件读取日志信息
  file {
    path => "/xxx/demolog/log/demolog-*.log"
    type => "ghn"
    start_position => "beginning"
  }

}

output {
  # 输出到 elasticsearch
  elasticsearch {
    hosts => ["localhost:9200"]
    user => "elastic"
    password => "xxxxxx"
    ssl => "true"
    cacert => "/xxx/elk/logstash-8.9.1/config/certs/http_ca.crt"
    index => "ghn-%{+YYYY.MM.dd}"
  }
  stdout {  }
}

input为tcp

配合springboot/springcloud使用
springboot配置
官方github:https://github.com/logfellow/logstash-logback-encoder
在pom.xml添加依赖
        <dependency>
            <groupId>net.logstash.logback</groupId>
            <artifactId>logstash-logback-encoder</artifactId>
            <version>7.4</version>
        </dependency>
在logback-spring.xml添加配置
    <appender name="stash" class="net.logstash.logback.appender.LogstashTcpSocketAppender">
        <destination>127.0.0.1:4560</destination>
        <!-- encoder is required -->
        <encoder class="net.logstash.logback.encoder.LogstashEncoder" />
    </appender>

    <root level="info">
        <appender-ref ref="CONSOLE"/>
        <appender-ref ref="stash" />
    </root>
logstash配置
input {
  # 从文件读取日志信息
  tcp {
    host => "0.0.0.0"
    mode => "server"
    port => 4560
    codec => json_lines
  }

}

output {
  # 输出到 elasticsearch
  elasticsearch {
    hosts => ["localhost:9200"]
    user => "elastic"
    password => "xxxxxx"
    ssl => "true"
    cacert => "xxx/logstash-8.9.1/config/certs/http_ca.crt"
    index => "ghn-%{+YYYY.MM.dd}"
  }
  stdout { }
  # stdout { codec => rubydebug }
}
-
logstash终端查看


-
kibana查看

input为filebeats

filebeats配置
- 配置文件位置:
filebeat-8.9.1-darwin-aarch64/filebeat.yml,修改如下部分,指定log位置为springboot的目录
filebeat.inputs:
- type: filestream
  enabled: true
  paths:
    - /xxx/xxx/*.log
- 启动
./filebeat -e -c filebeat.yml -d "publish"
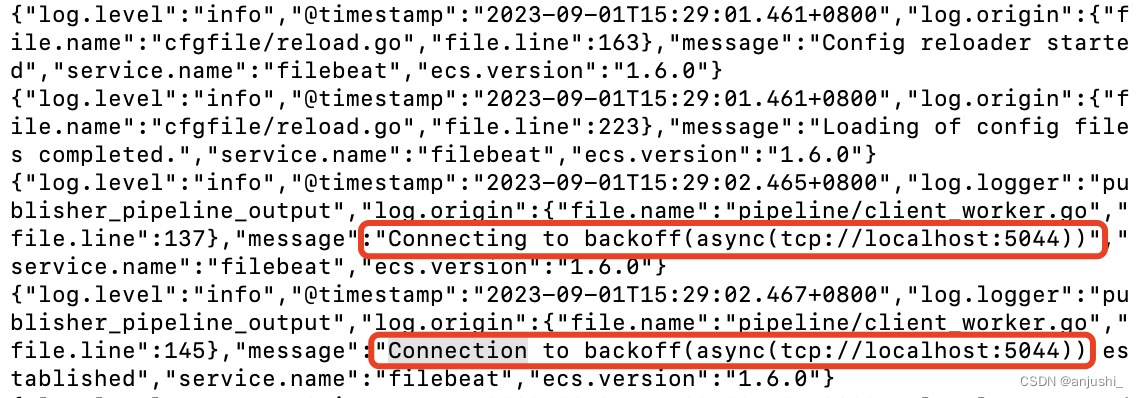
与logstash建立了连接,启动成功
logstash配置
input {
  beats {
    port => 5044
  }
}

output {
  elasticsearch {
    hosts => ["localhost:9200"]
    user => "elastic"
    password => "xxxxxx"
    ssl => "true"
    cacert => "/xxxx/logstash-8.9.1/config/certs/http_ca.crt"
    index => "%{[@metadata][beat]}-%{[@metadata][version]}-%{+YYYY.MM.dd}"
  }
}
- 启动logstash
bin/logstash -f config/logstash-filebeat.conf
- 获取从filebeats发来的日志

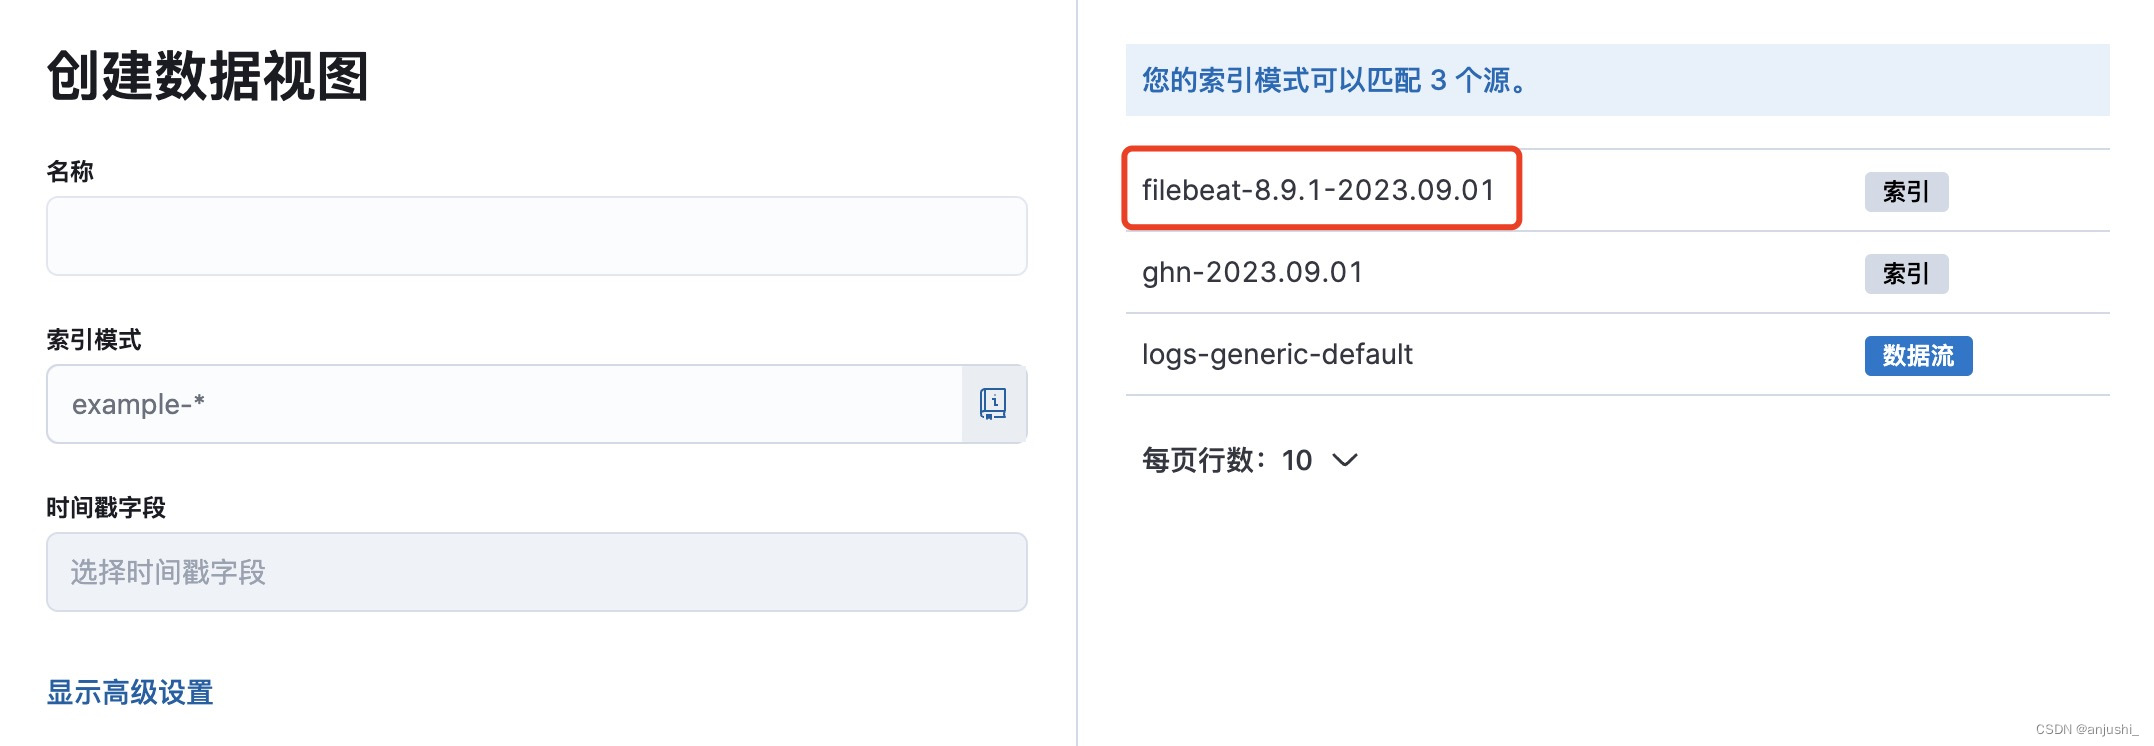
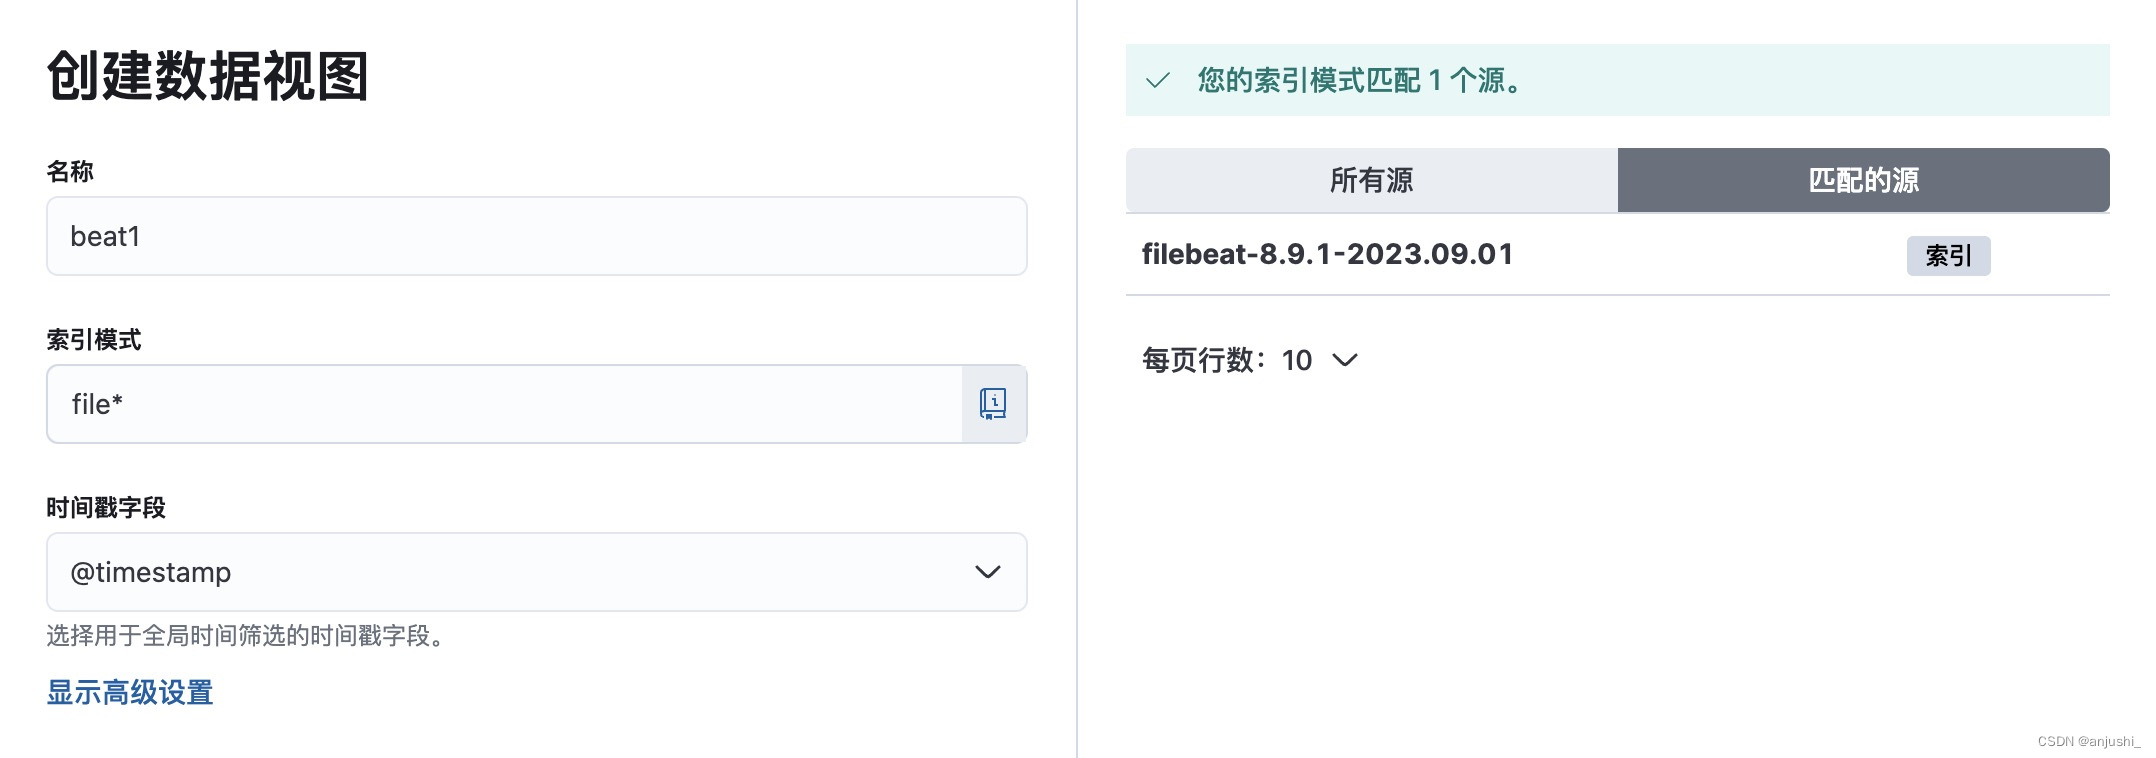
kibana
-
kibana中数据视图已经能够看到
-
查看详情

input为kafka

官方文档:https://www.elastic.co/guide/en/logstash/current/use-filebeat-modules-kafka.html
filebeats设置
output.kafka:
  hosts: ["localhost:9092"]
  topic: "filebeat"
  codec.json:
    pretty: false
./filebeat -e -c filebeat.yml -d "publish"
logstash配置
input {
  kafka {
    bootstrap_servers => ["localhost:9092"]
    topics => ["filebeat"]
    codec => json
  }

}

output {
  # 输出到 elasticsearch
  elasticsearch {
    hosts => ["localhost:9200"]
    user => "elastic"
    password => "xxxxxx"
    ssl => "true"
    cacert => "/xxx/elk/logstash-8.9.1/config/certs/http_ca.crt"
    index => "ghn-%{+YYYY.MM.dd}"
  }
  stdout { }
  # stdout { codec => rubydebug }
}
-
kafka启动

-
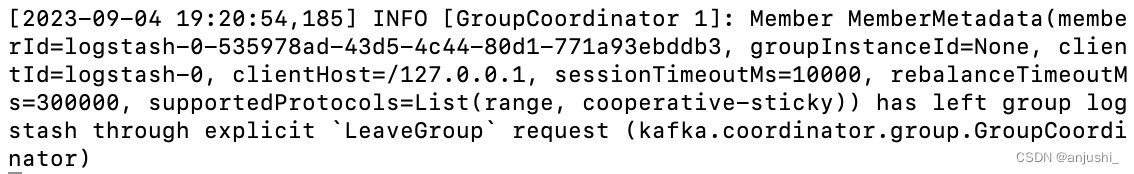
logstash查看

-
kafka关闭
https://www.elastic.co/guide/en/logstash/current/plugins-inputs-kafka.html


 3514
3514


 被折叠的 条评论
为什么被折叠?
被折叠的 条评论
为什么被折叠?
 到【灌水乐园】发言


