


Apache Zeppelin : Web-based notebook that enables data-driven, interactive data analytics and collaborative documents with SQL, Scala, Python, R and more.
Interpreters in Apache Zeppelin
In this section, we will explain about the role of interpreters, interpreters group and interpreter settings in Zeppelin. The concept of Zeppelin interpreter allows any language/data-processing-backend to be plugged into Zeppelin. Currently, Zeppelin supports many interpreters such as Scala ( with Apache Spark ), Python ( with Apache Spark ), SparkSQL, JDBC, Markdown, Shell and so on.
1、IDEA通过JDBC试连KyLin
pom.xml添加kylin-jdbc依赖
<dependencies>
      <dependency>
          <groupId>org.apache.kylin</groupId>
          <artifactId>kylin-jdbc</artifactId>
          <version>3.0.2</version>
      </dependency>
</dependencies>
编写Java试连KyLin的代码
import java.sql.Connection;
import java.sql.DriverManager;
import java.sql.PreparedStatement;
import java.sql.ResultSet;

public class TestKylin {

    public static void main(String[] args) throws Exception {

        //Kylin_JDBC 驱动
        String KYLIN_DRIVER = "org.apache.kylin.jdbc.Driver";

        //Kylin_URL
        // 连接字符串:jdbc:kylin://ip地址:7070/项目名称(project)
        String KYLIN_URL = "jdbc:kylin://hadoop102:7070/gmall";

        //Kylin的用户名
        String KYLIN_USER = "ADMIN";

        //Kylin的密码
        String KYLIN_PASSWD = "KYLIN";

        //添加驱动信息
        Class.forName(KYLIN_DRIVER);

        //获取连接
        Connection connection = DriverManager.getConnection(KYLIN_URL, KYLIN_USER, KYLIN_PASSWD);

        //预编译SQL
        PreparedStatement ps = connection.prepareStatement("SELECT SUM(sku_num) FROM DWD_ORDER_DETAIL ");

        //执行查询
        ResultSet resultSet = ps.executeQuery();

        //遍历打印
        while (resultSet.next()) {
            System.out.println(resultSet.getInt(1));
        }
    }
}
2、安装Zepplin
解压zeppelin
[atguigu@hadoop102 software]$ tar -zxvf zeppelin-0.8.0-bin-all.tgz -C /opt/module/
改端口号:默认是8080,为避免冲突,修改为其他端口号
[atguigu@hadoop102 conf]$ mv zeppelin-site.xml.template zeppelin-site.xml
[atguigu@hadoop102 conf]$ cat zeppelin-site.xml
<property>
  <name>zeppelin.server.port</name>
  <!--改默认端口号8080为8000-->
  <value>8000</value>
  <description>Server port.</description>
</property>
启动zeppelin
[atguigu@hadoop102 zeppelin-0.8.0-bin-all]$ bin/zeppelin-daemon.sh start
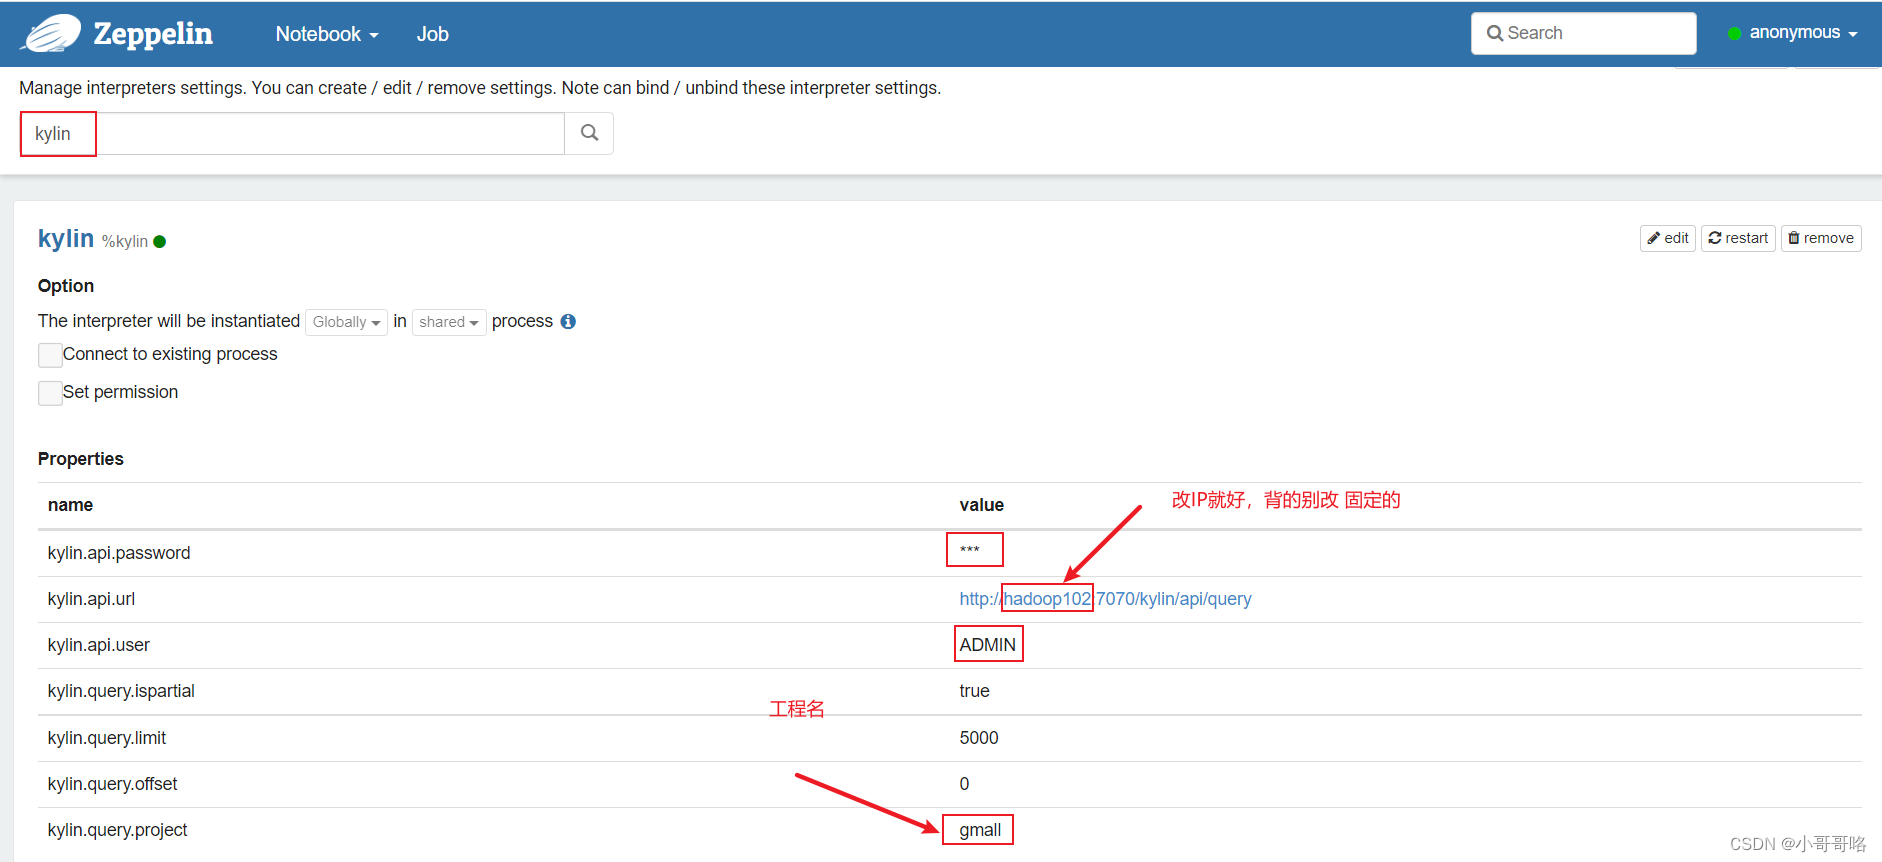
3、通过Zepplin的KyLin解释器连接KyLin
配置Kylin解释器信息
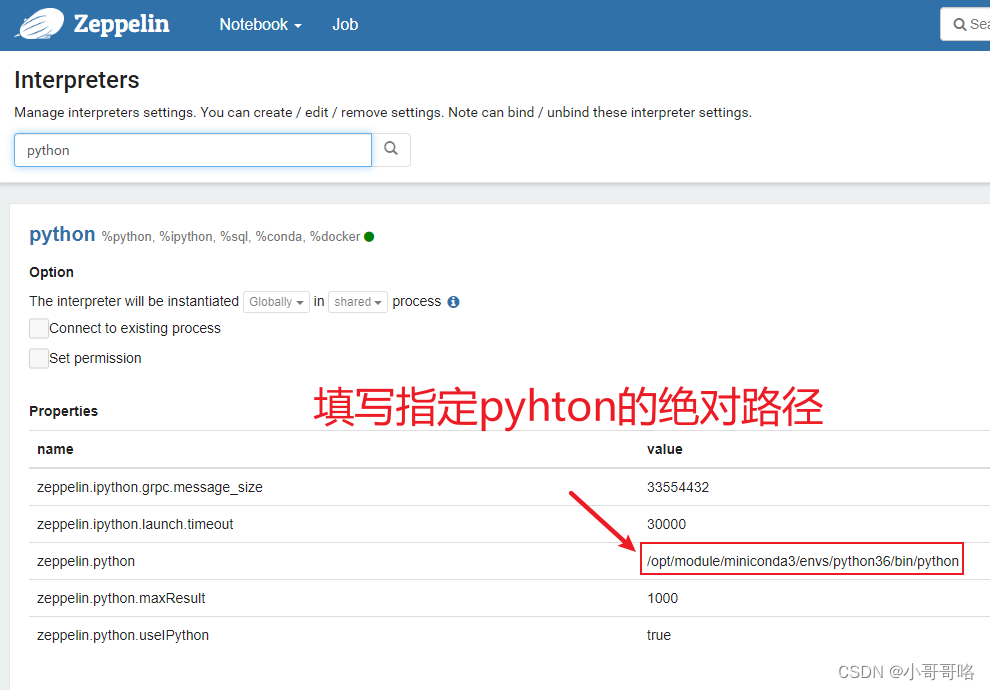
4、通过Zepplin的python解释器连接KyLin
配置Python数据可视化环境
# conda创建python3.6环境
[atguigu@hadoop102 software]$ conda create --name python36 python=3.6
(python36) [atguigu@hadoop102 software]$ conda activate python36
# 安装kylinpy及绘图相关的包
(python36) [atguigu@hadoop102 software]$ pip install --upgrade kylinpy
(python36) [atguigu@hadoop102 software]$ pip install SQLAlchemy
(python36) [atguigu@hadoop102 software]$ pip install pandas
(python36) [atguigu@hadoop102 software]$ pip install matplotlib
(python36) [atguigu@hadoop102 software]$ conda deactivate
配置Python解释器信息
通过Python连接Kylin
import sys
import sqlalchemy as sa
import pandas as pd
import matplotlib.pyplot as plt

print(sys.version)
print(sys.version_info)

# 配置kylin连接信息
kylin_engine = sa.create_engine('kylin://ADMIN:KYLIN@hadoop102:7070/gmall?version=v1')

# 编写SQL语句
sql = 'SELECT SUM(sku_num) FROM DWD_ORDER_DETAIL'

# 执行sql语句,获得执行结果
# results = kylin_engine.execute(sql)

# 执行sql语句,获得执行结果,并将结果存储到pandas
dataframe = pd.read_sql(sql, kylin_engine)

# 打印结果
print(dataframe)

# 将结果绘图
dataframe.plot(kind='pie')
plt.show()
5、pandas与matplotlib绘图入门
matplotlib.pyplot is a collection of functions that make matplotlib work like MATLAB. Each pyplot function makes some change to a figure: e.g., creates a figure, creates a plotting area (Axes) in a figure, plots some lines in a plotting area, decorates the plot (title、Axis、label) with labels, etc.
In matplotlib.pyplot various states are preserved across function calls, so that it keeps track of things like the current figure and plotting area, and the plotting functions are directed to the current axes (please note that “axes” here and in most places in the documentation refers to the axes part of a figure and not the strict mathematical term for more than one axis).
import matplotlib.pyplot as plt
# plt是接口
print(type(plt),plt)
<class 'module'> <module 'matplotlib.pyplot' from 'C:\\Program Files\\Anaconda3\\lib\\site-packages\\matplotlib\\pyplot.py'>
fig, ax = plt.subplots()
# fig=figure, ax=Axes 是对象
print(type(fig),fig)
print(type(ax),ax)
<class 'matplotlib.figure.Figure'> Figure(432x288)
<class 'matplotlib.axes._subplots.AxesSubplot'> AxesSubplot(0.125,0.125;0.775x0.755)
# 为什么plt没有指定画布figure和区域Axes也能作图plot ?
"""
因为matplotlib默认在【最近创建】的画布上绘制,而当你没有指定区域,告诉它去画图,
他就会自动去生成一个Axes去绘制,进一步没有画布,也会自动去创建一个Figure,也称为隐式绘制。
"""
plt.bar([1,2,3],[4,5,6])
# 当有多个Axes时,直接使用plt绘图只能操作最近一个创建的Axes
# 此时使用plt.subplots创建Axes数组,通过Axes元素单个操作每一个Axes
fig, axes = plt.subplots(1,3,figsize=(16,6))
ax1 = axes[0]
ax2 = axes[1]
ax3 = axes[2]

ax2.barh([1,2,3,4,5],[1,2,3,4,5])

plt.show()
plt.figure(figsize=(16,6))
ax1 = plt.subplot(1,3,1)

ax2 = plt.subplot(1,3,2)
# plt.bar得紧跟ax2才能操作ax2
plt.bar([1,2,3,4,5],[1,2,3,4,5])

# plt.subplots一次创建多个Axes,plt.subplot一次创建一个并每次指定Axes排列规则
ax3 = plt.subplot(1,3,3)

# ax1的Axes的plot非必须紧跟ax1
ax1.plot([1,2,3,4,5],[1,2,3,4,5])

plt.show()
fig = plt.figure(figsize=(16,6))
# plt.subplot、fig.add_subplot分别是通过pyplot接口、figure对象创建Axes
ax4 = fig.add_subplot(121)
ax4.plot([1,2,3,4,5],[1,2,3,4,5])
ax5 = fig.add_subplot(122)
ax5.plot([1,2,3,4,5],[1,2,3,4,5])

plt.show()
pandas.DataFrame和pandas.Series可以设置matplotlib axes object, default None
pandas.DataFrame.plot
pandas.Series.plot
matplotlib.axes


 1万+
1万+


 被折叠的 条评论
为什么被折叠?
被折叠的 条评论
为什么被折叠?
 到【灌水乐园】发言


