


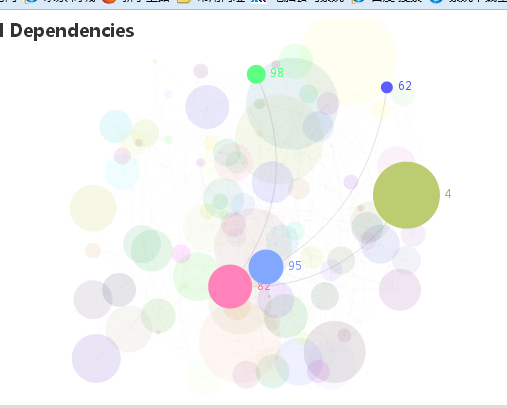
效果图如上:
实例:
生成随机数据的json的js代码:
<!doctype html>
<html lang="en">
<head>
 <!-- <meta charset="UTF-8"> -->
 <meta http-equiv="Content-Type" content="text/html; charset=UTF-8">
</head>
<body>
    <!-- <script type="text/javascript" src="json2.js"></script> -->
    <script type ="text/javascript">
        var enoughBigSize = 0;
        var jsObject = new Array();
        var j = 0;
            for(var i = 0;i<100;i++){
                jsObject[i] = {
                    x:Math.ceil(Math.random()*100),
                    y:Math.ceil(Math.random()*100),
                    name:j,
                    id:j,
                    symbolSize:function(){
                        if(enoughBigSize<8){
                            var mathRandom =Math.ceil(Math.random()*100);
                            if(mathRandom>50)
                                enoughBigSize++;
                        }else{
                             mathRandom =Math.floor(Math.random()*50)
                        }

                        return mathRandom;
                    }(),
                    nodeColor:function(){
                        var a = '#';
                        var number = ['0','1','2','3','4','5','6','7','8','9','a','b','c','d','e','f'];
                        for(var i = 0;i<3;i++){
                            temp =Math.floor(Math.random()*16);
                            a = a + number[temp];
                        }
                        return a;
                    }(),

                };
                j++;
            }
        console.log(jsObject);
        var JsonObject = JSON.stringify(jsObject);
        console.log(JsonObject);
        var edgesObject = new Array();
        for(var i = 0;i < 200;i++){
            edgesObject[i] = {
                sourceID:Math.floor(Math.random()*100),
                targetID:Math.floor(Math.random()*100)
            }

        }

        var graphObject = {
            nodes:jsObject,
            edges:edgesObject
        }
        console.log(graphObject);
        var graphObjectJson = JSON.stringify(graphObject);
        console.log(graphObjectJson);
    </script>

</body>
</html>
生成图例代码:
<!DOCTYPE html>
<html>
<head>
    <meta charset="utf-8">
    <!-- 引入 ECharts 文件 -->
    <script src="js/jquery-2.1.4.min.js"></script>
    <script src="js/echarts.js"></script>
</head>
<body>
    <!-- 为 ECharts 准备一个具备大小(宽高)的 DOM -->
    <div id="main" style="width: 600px;height:400px;"></div>
    <script type="text/javascript">
        // 基于准备好的dom,初始化echarts实例
        var myChart = echarts.init(document.getElementById('main'));
        myChart.showLoading();
        $.getJSON('demo.json', function (json) {
            alert(1);
            myChart.hideLoading();
            myChart.setOption(option = {
                title: {
                    text: 'NPM Dependencies'
                },
                animationDurationUpdate: 1500,
                animationEasingUpdate: 'quinticInOut',
                series : [
                    {
                        type: 'graph',
                        layout: 'none',
                        // progressiveThreshold: 700,
                        data: json.nodes.map(function (node) {
                            return {
                                x: node.x,
                                y: node.y,
                                id: node.id,
                                name: node.name,
                                symbolSize: node.symbolSize,
                                itemStyle: {
                                    normal: {
                                        color: node.nodeColor
                                    }
                                }
                            };
                        }),
                        edges: json.edges.map(function (edge) {
                    return {
                        source: edge.sourceID,
                        target: edge.targetID
                    };
                }),
                        label: {
                            emphasis: {
                                position: 'right',
                                show: true
                            }
                        },
                        roam: true,
                        focusNodeAdjacency: true,
                        lineStyle: {
                            normal: {
                                width: 0.5,
                                curveness: 0.3,
                                opacity: 0.7
                            }
                        }
                    }
                ]
            }, true);
        });
    </script>
</body>
</html>


 274
274

 被折叠的 条评论
为什么被折叠?
被折叠的 条评论
为什么被折叠?
 到【灌水乐园】发言


