


matplotlib是一个用于创建出版质量图表的桌面绘图包(主要用于2D),其目的是为Python构建一个MATLAB式的绘图接口。
import numpy as np
import matplotlib.pyplot as plt
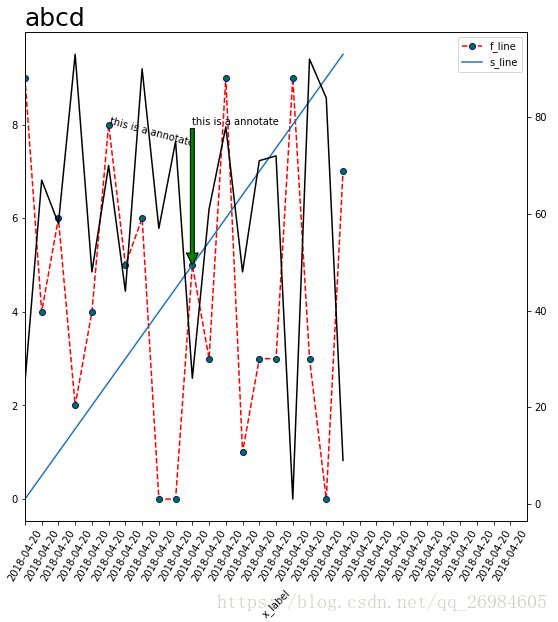
%matplotlib inliney = np.random.randint(0,10,20)
x = range(20)fig,ax = plt.subplots(figsize = (9,9))
ax.plot(x,y,
c = 'red',
ls = 'dashed',
marker = 'o',
mfc = 'g',
mec = 'b',
label = 'f_line'
)
ax.set_title('abcd',loc='left',fontdict={'fontsize':25})#可以设置标题,位置,字体设置等
ax.set_xlabel('x_label',rotation=45)#y轴同理,也可以设置字体,旋转角度等,上述title同理
ax.set_xlim(0,30) #设置坐标轴范围
ax.set_xticks(range(30))
ax.set_xticklabels(['2018-04-20']*30,rotation=60)#设置坐标轴标注
ax.plot(x,0.5*np.array(x),label = 's_line')#多加一条线
ax.legend(prop=dict(size=10)) #绘制图例,之前的线条必须先设置label,否则无法绘制图例,同理可设置图例大小
#节点标注
ax.annotate('this is a annotate',xy=[5,y[5]] ,rotation=-15)
ax.annotate('this is a annotate',xy=[10,y[10]],xytext = [10,8],arrowprops = dict(facecolor='g'))
#共用X轴
ax2 = ax.twinx()
y2 = np.random.randint(0,100,20)
ax2.plot(x,y2,'k')
![]()
#参数别名,使用全称与别名有同样效果(并不是所有参数)

_alias_map = {'color': ['c'],#线条颜色
              'linewidth': ['lw'],#线条宽度
              'linestyle': ['ls'],#线条类型
              'facecolor': ['fc'],#填充色,默认为线条颜色
              'edgecolor': ['ec'],#轮廓颜色
              'markerfacecolor': ['mfc'],#节点填充色
              'markeredgecolor': ['mec'],#节点轮廓色
              'markeredgewidth': ['mew'],#节点边缘线宽
              'markersize': ['ms'],#节点大小
             }
the line style or marker:(线条或者节点类型列表)
================ ===============================
character description
================ ===============================
``'-'`` solid line style
``'--'`` dashed line style
``'-.'`` dash-dot line style
``':'`` dotted line style
``'.'`` point marker
``','`` pixel marker
``'o'`` circle marker
``'v'`` triangle_down marker
``'^'`` triangle_up marker
``'<'`` triangle_left marker
``'>'`` triangle_right marker
``'1'`` tri_down marker
``'2'`` tri_up marker
``'3'`` tri_left marker
``'4'`` tri_right marker
``'s'`` square marker
``'p'`` pentagon marker
``'*'`` star marker
``'h'`` hexagon1 marker
``'H'`` hexagon2 marker
``'+'`` plus marker
``'x'`` x marker
``'D'`` diamond marker
``'d'`` thin_diamond marker
``'|'`` vline marker
``'_'`` hline marker
================ ===============================The following color abbreviations are supported:颜色列表
========== ========
character color
========== ========
'b' blue
'g' green
'r' red
'c' cyan
'm' magenta
'y' yellow
'k' black
'w' white
========== ========


 3117
3117

 被折叠的 条评论
为什么被折叠?
被折叠的 条评论
为什么被折叠?
 到【灌水乐园】发言


