


主成分分析(Principal Component Analysis,PCA)是一种降维方法,通常用于降低大型数据集的维数。PCA作图可用于查看数据的分布,是否有批次效应等。
prcomp {stats}
Description
Performs a principal components analysis on the given data matrix and returns the results as an object of class prcomp.
Usage
prcomp(x, ...)

## S3 method for class 'formula'
prcomp(formula, data = NULL, subset, na.action, ...)

## Default S3 method:
prcomp(x, retx = TRUE, center = TRUE, scale. = FALSE,
       tol = NULL, rank. = NULL, ...)

## S3 method for class 'prcomp'
predict(object, newdata, ...)
Arguments
formula | a formula with no response variable, referring only to numeric variables. |
data | an optional data frame (or similar: see |
subset | an optional vector used to select rows (observations) of the data matrix |
na.action | a function which indicates what should happen when the data contain |
... | arguments passed to or from other methods. If |
x | a numeric or complex matrix (or data frame) which provides the data for the principal components analysis. |
retx | a logical value indicating whether the rotated variables should be returned. |
center | a logical value indicating whether the variables should be shifted to be zero centered. Alternately, a vector of length equal the number of columns of |
scale. | a logical value indicating whether the variables should be scaled to have unit variance before the analysis takes place. The default is |
tol | a value indicating the magnitude below which components should be omitted. (Components are omitted if their standard deviations are less than or equal to |
rank. | optionally, a number specifying the maximal rank, i.e., maximal number of principal components to be used. Can be set as alternative or in addition to |
object | object of class inheriting from |
newdata | An optional data frame or matrix in which to look for variables with which to predict. If omitted, the scores are used. If the original fit used a formula or a data frame or a matrix with column names, |
R代码
###1.基因表达数据数据
data() # 产看R内置数据集
data(sample.ExpressionSet) # 载入数据集
#featureNames(sample.ExpressionSet)
#sampleNames(sample.ExpressionSet)
## 表达谱数据 matrix
exprs_matrix <- exprs(sample.ExpressionSet)
# 转置后,行为样品,列为特征
m_matrix <- t(exprs_matrix)
#head(m_matrix)
#dim(m_matrix)
## 表型数据
pdata <- phenoData(sample.ExpressionSet)
class(pdata) #[1] "AnnotatedDataFrame"
# AnnotatedDataFrame转data.frame
p_df <- as(pdata, "data.frame")
#colnames(p_df)
#rownames(p_df)
###2.主成分分析
# 每一个样品的表达谱数据进行PCA分析
pca <- prcomp(m_matrix,center = TRUE,scale. = TRUE)
class(pca) #"prcomp"
# pca$sdev,pca$center,pca$scale,pca$rotation, pca$x
# 各样品的PCA结果
m_df <- as.data.frame(pca$x)
summ <- summary(pca)
# summ$importance,summ$sdev,summ$center,summ$scale,summ$rotation, summ$x
# 提取主成分的方差贡献率,生成坐标轴标题
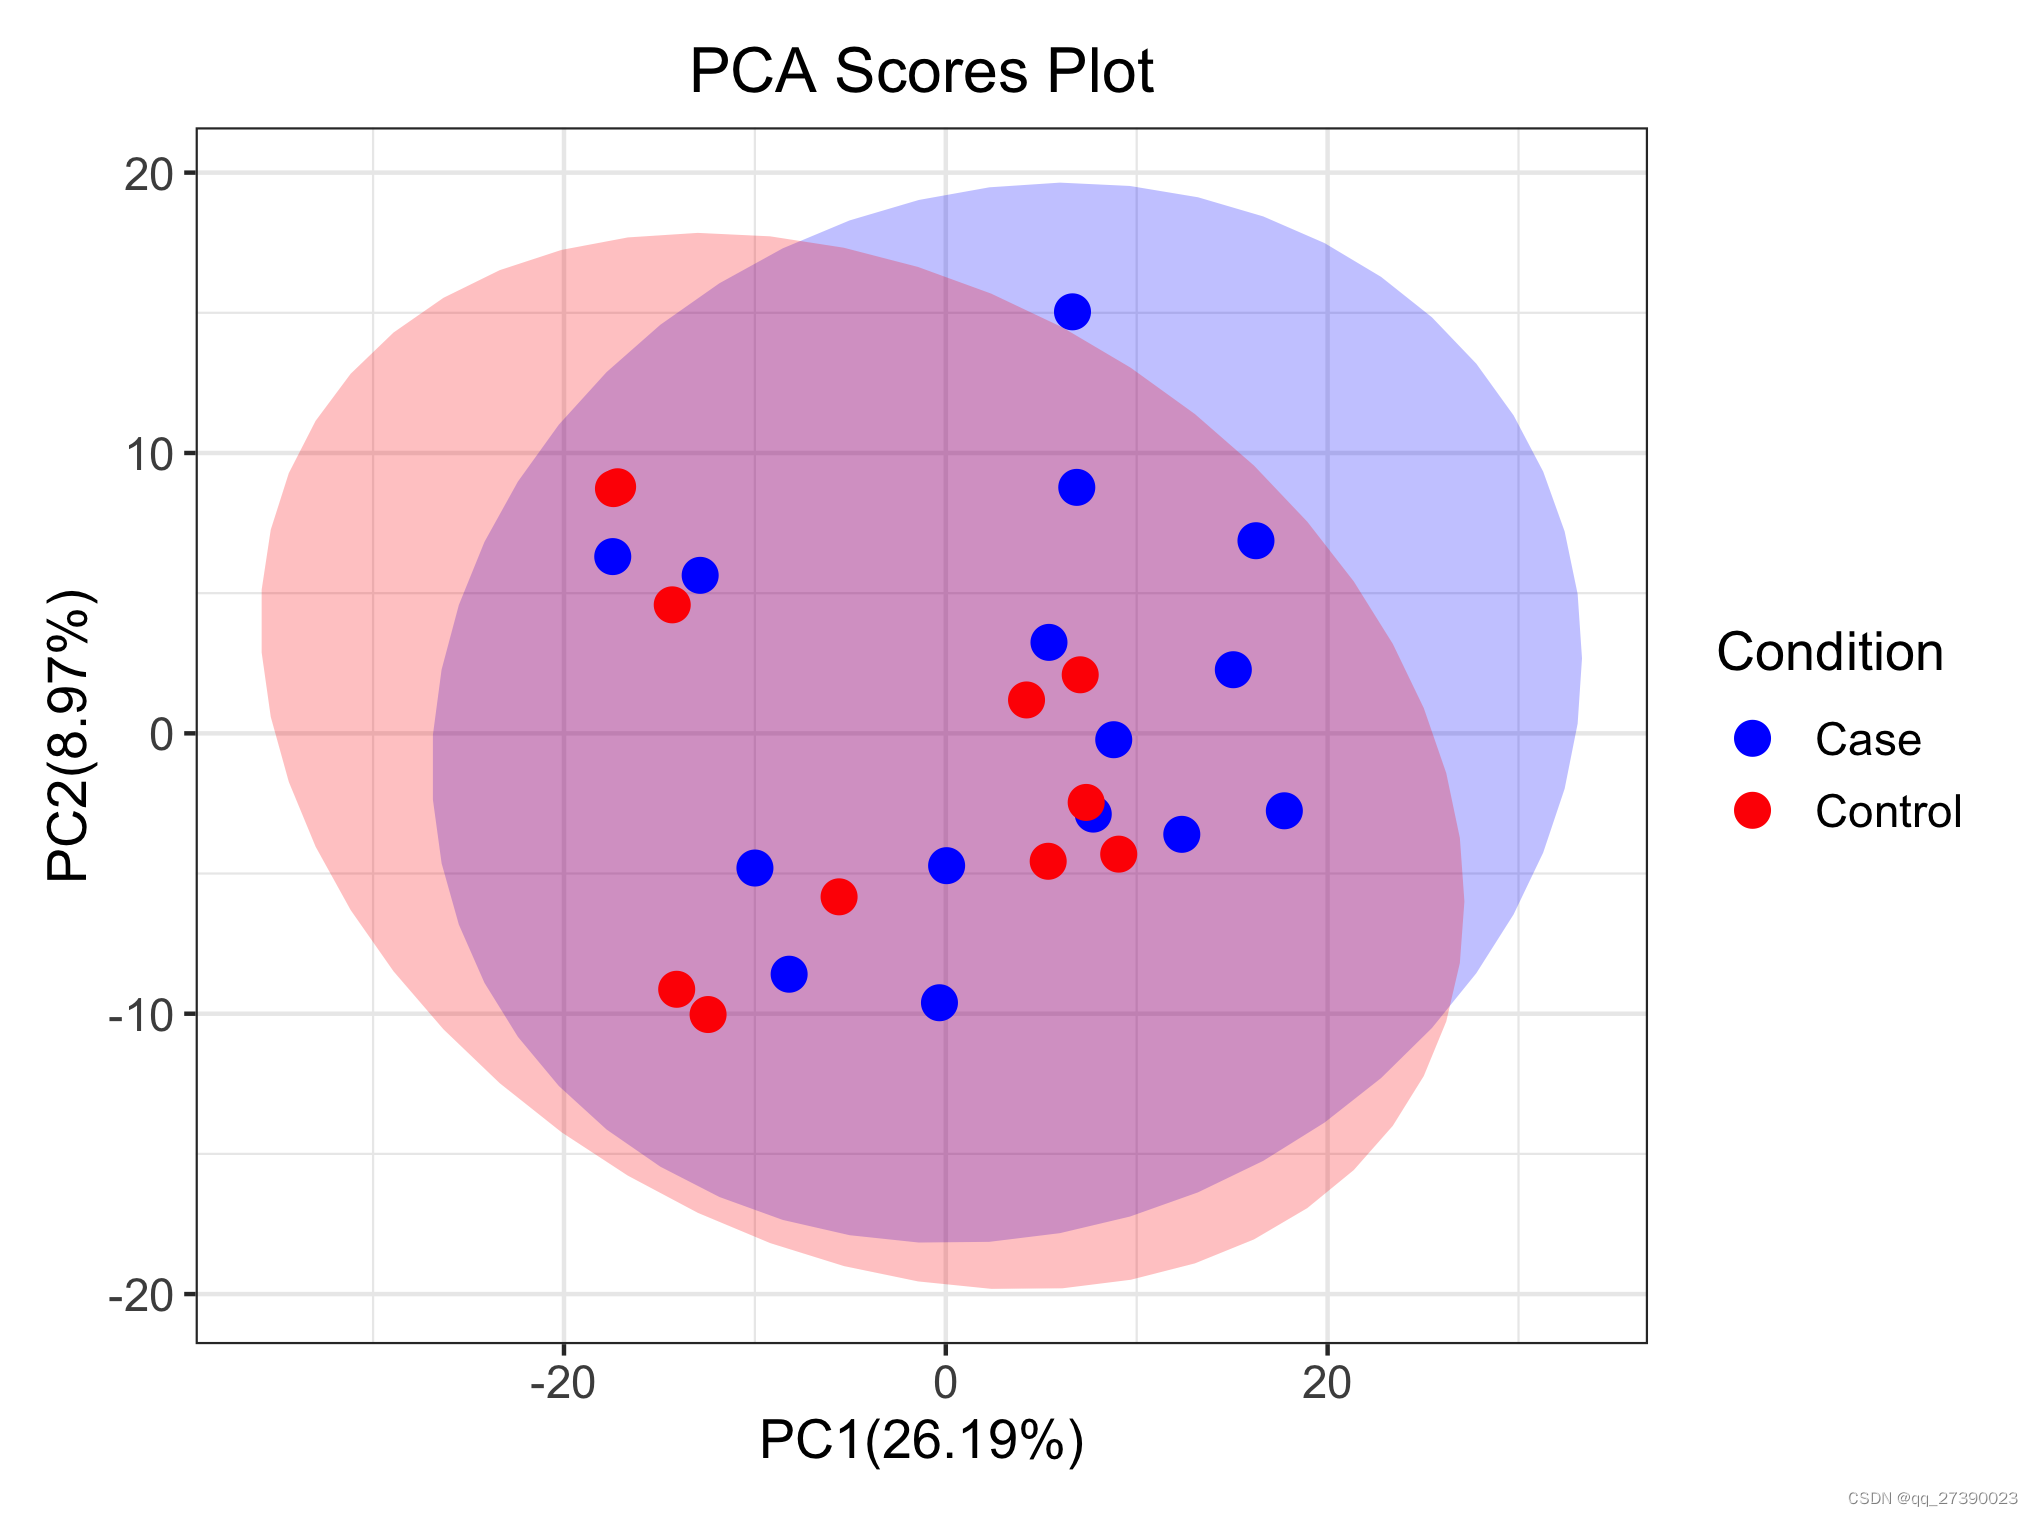
xlab <- paste0("PC1(",round(summ$importance[2,1]*100,2),"%)")
ylab <- paste0("PC2(",round(summ$importance[2,2]*100,2),"%)")
## 合并PCA结果和表型数据
final_df<-cbind(m_df,p_df)
###3.绘制PCA图
library(ggplot2)
p.pca <- ggplot(data = final_df,aes(x = PC1,y = PC2,color = type))+
stat_ellipse(aes(fill = type),
type = "norm",geom = "polygon",alpha = 0.25,color = NA)+ # 添加置信椭圆
geom_point(size = 3.5)+
# color = "Condition" 改变注释的文字
labs(x = xlab,y = ylab,color = "Condition",title = "PCA Scores Plot")+
guides(fill = "none")+
theme_bw()+
scale_fill_manual(values = c("blue","red"))+
scale_colour_manual(values = c("blue","red"))+
theme(plot.title = element_text(hjust = 0.5,size = 15),
axis.text = element_text(size = 11),axis.title = element_text(size = 13),
legend.text = element_text(size = 11),legend.title = element_text(size = 13),
plot.margin = unit(c(0.4,0.4,0.4,0.4),'cm'))
p.pca
#ggsave(p.pca,filename = "PCA.pdf") # 保存文件


 被折叠的 条评论
为什么被折叠?
被折叠的 条评论
为什么被折叠?
 到【灌水乐园】发言


