


R2023a来啦!!废话不多说看看新版本有啥有趣的玩意和好玩的特性叭!!把绘图放最前面叭,有图的内容看的人多。
1 区域填充
可以使用xregion及yregion进行区域填充啦!!
x = -10:0.25:10;
y = x.^2;
plot(x,y)
xregion(-5,5)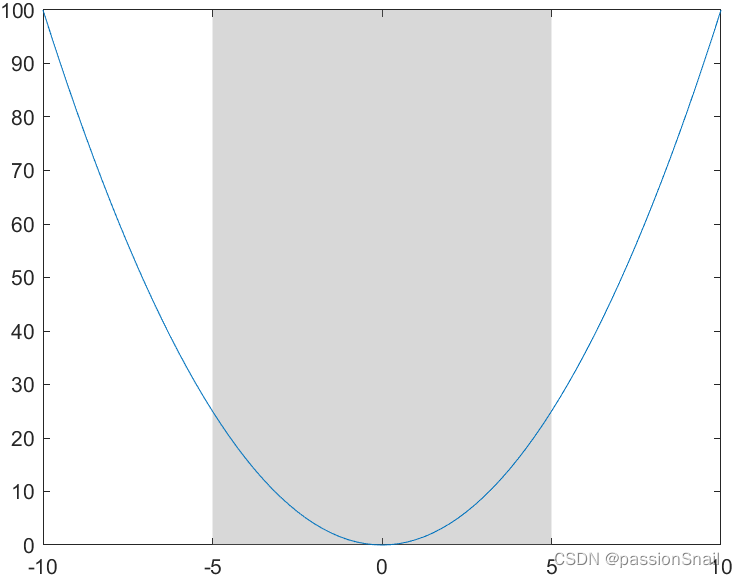
Count = randn(1,1000);
histogram(Count)
xr = xregion([-2 1],[-1 2]);
Count = randn(1,1000);
histogram(Count)
xr = xregion([-2 1],[-1 2]);

xr(1).FaceColor = "r";
xr(1).DisplayName = "Low";
xr(2).FaceColor = "#0073FD";
xr(2).DisplayName = "High";
legend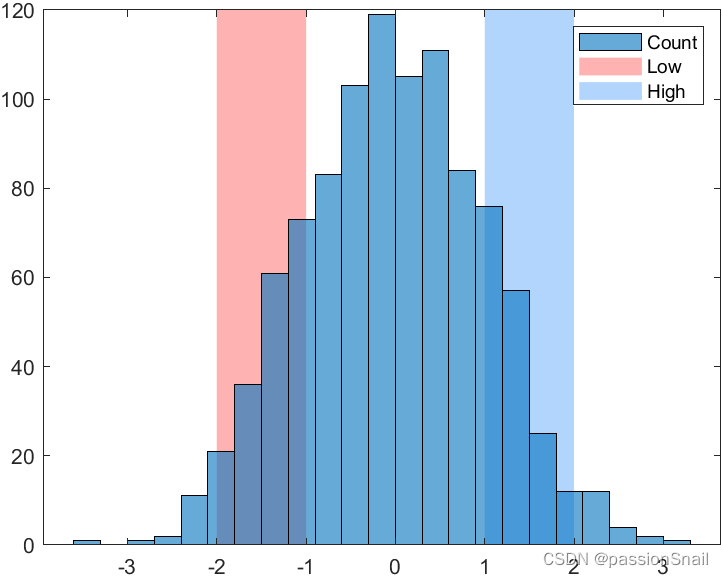
x = 0:0.1:50;
y = 2*x .* (sin(x) + cos(2*x));
plot(x,y)
yregion(0,106)
2 新配色sky
这么多年了终于出了个新配色,这个就是heatmap函数使用的默认配色:
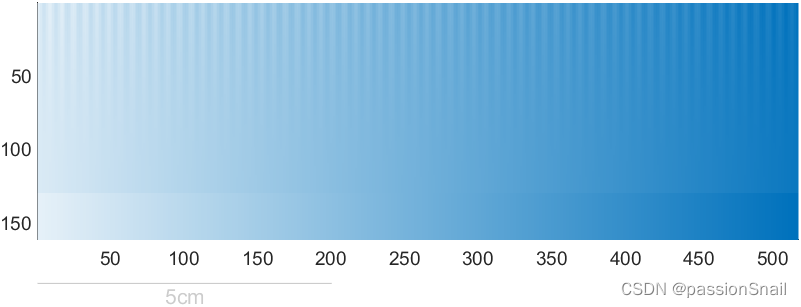
展示一下叭:
X=rand(10);
CF=contourf(X);
colormap(sky)
colorbar 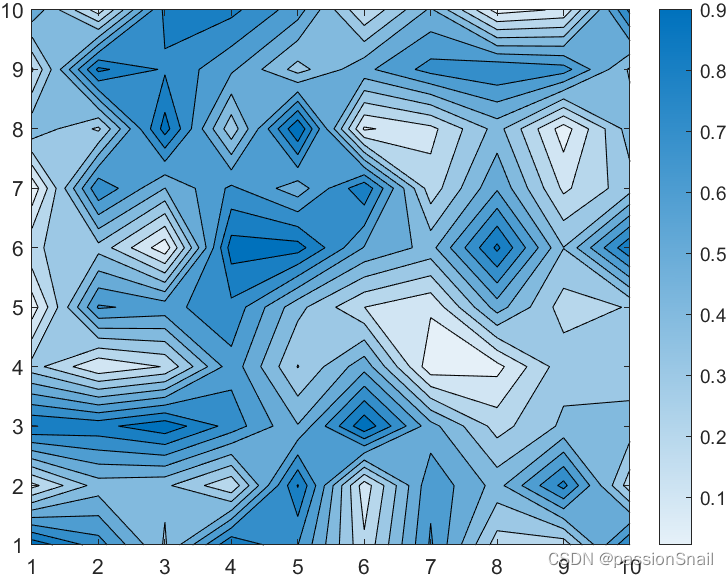
X=linspace(0,1,200)';
CL=(-cos(X*2*pi)+1).^.2;
r=(X-.5)'.^2+(X-.5).^2;
surf(X,X',abs(ifftn(exp(7i*rand(200))./r.^.9)).*(CL*CL')*30,'EdgeColor','none')

colormap(sky)
light
material dull
view(59.1823,56.1559)
colorbar

% 修饰一下
ax=gca;
ax.Projection='perspective';
ax.LineWidth=.8;
ax.XMinorTick='on';
ax.YMinorTick='on';
ax.ZMinorTick='on';
ax.GridLineStyle=':';
ax.FontName='Cambria';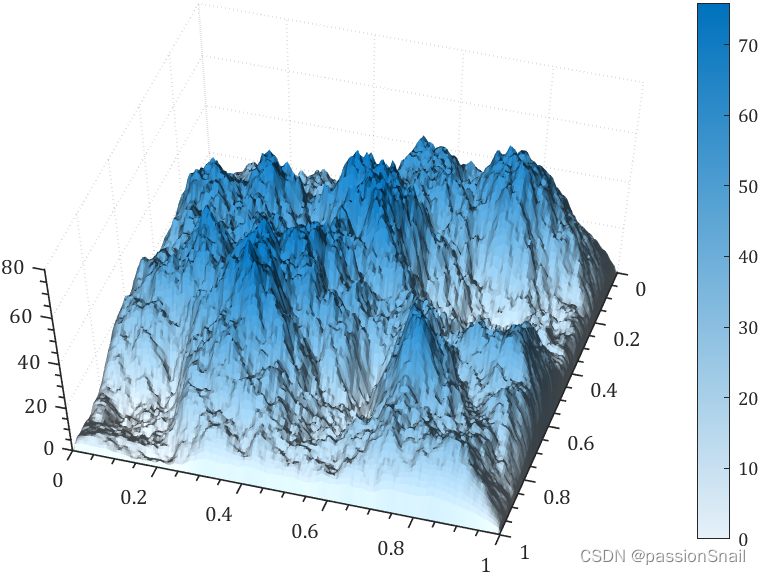
t=linspace(0,5*pi,200);
C=sky(70);
ax=gca;hold on
for i=1:70
    plot(t,sin(t+i.^2./700)./(10+i).*20+i.*.1,'Color',C(i,:),'LineWidth',2);
end

% 坐标区域修饰
ax.YLim=[0,7];
ax.XLim=[0,5*pi];
ax.YTick=0:.5:5;
ax.XTick=0:1:15;
% ax.XGrid='on';
ax.YGrid='on';
ax.GridLineStyle='-.';
ax.LineWidth=1.2;
ax.XMinorTick='on';
ax.YMinorTick='on';
ax.Box='on';
ax.FontName='Cambria';
ax.FontWeight='bold';
ax.FontSize=12;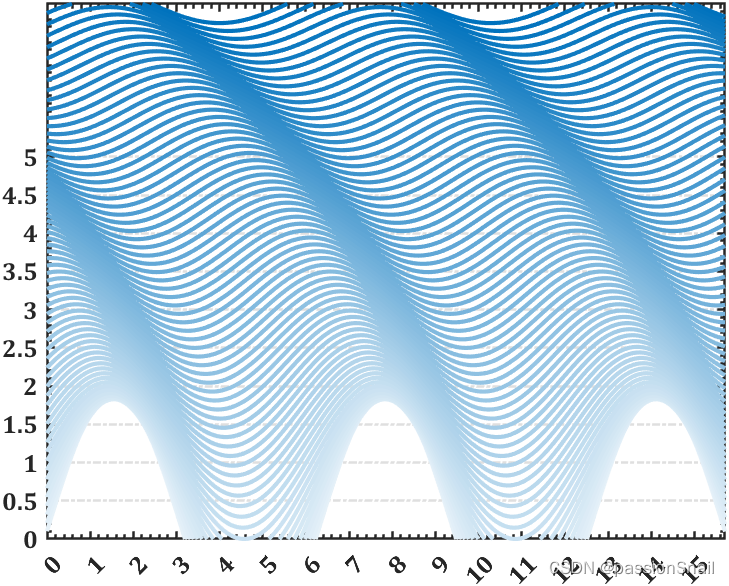
3 tiledlayout水平或竖直布局
不需要预定义几行几列,设置为horizontal或vertical之后,就一直往上加就完事:
tiledlayout("horizontal")
x = 1:5;
nexttile
plot(x)
nexttile
bar(x);
nexttile
contourf(peaks)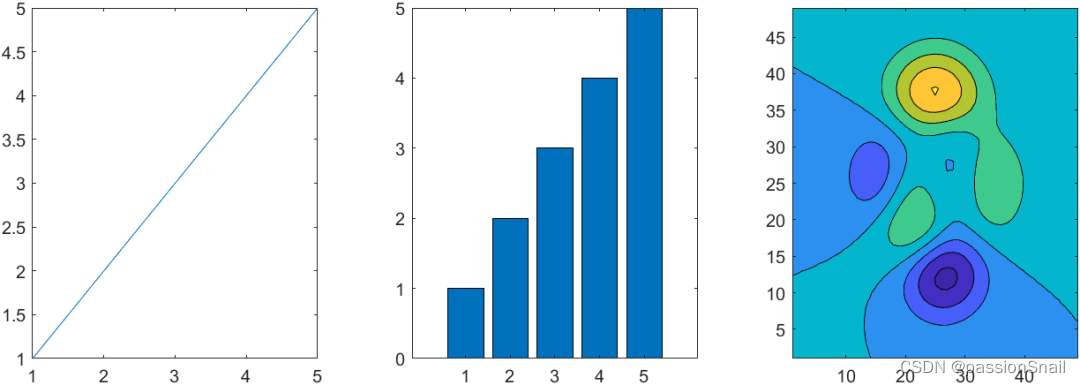
4 网格粗细
网格粗细可以不和坐标轴粗细相同啦,通过设置GridLineWidth属性设置网格粗细:
t=linspace(0,4*pi,300);
ax1=axes(gcf,'Position',[0+.05,.05,1/2-.05,.95]);
grid on;hold on;box on;axis tight
ax1.LineWidth=4;
plot(t,sin(t),'LineWidth',2)


ax2=axes(gcf,'Position',[1/2+.05,.05,1/2-.05,.95]);
grid on;hold on;box on;axis tight
ax2.LineWidth=4;
ax2.GridLineWidth=1;
plot(t,sin(t),'LineWidth',2)
5 轴标签旋转
轴标签可以旋转了,比如编写了如下代码:
plot([0 3 1 6 4 10],'LineWidth',2)
ylab = ylabel("Y Data");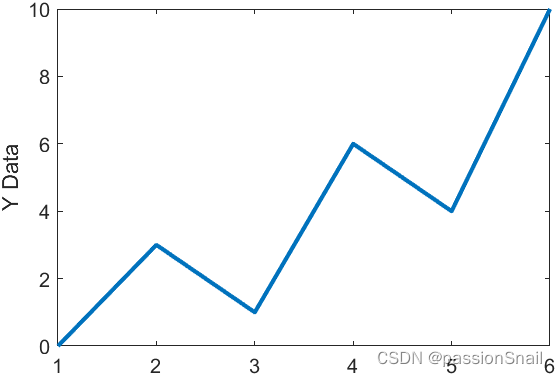
ylab.Rotation = 0;
6 颜色与线形
可以同时变,可以线条先变可以颜色先变,通过设置LineStyleCyclingMethod 属性来控制:
"withcolor"— 同时进行
"beforecolor"— 先线条循环
"aftercolor"— 先颜色循环
t=linspace(0,2.5*pi,200)+1*pi;

tiledlayout("horizontal",'TileSpacing','tight','Padding','tight')
ax1=nexttile();hold on;axis tight;box on
ax1.Title.String='withcolor';
ax1.Title.FontWeight='bold';
ax1.Title.FontSize=25;
ax1.LineWidth=1;
ax1.LineStyleOrder={'-','--',':'};
ax1.LineStyleCyclingMethod='withcolor';
for i=1:4
    plot(t,sin(t-pi/3*(i-1)),'LineWidth',2)
end

ax2=nexttile();hold on;axis tight;box on
ax2.Title.String='beforecolor';
ax2.Title.FontWeight='bold';
ax2.Title.FontSize=25;
ax2.LineWidth=1;
ax2.LineStyleOrder={'-','--',':'};
ax2.LineStyleCyclingMethod='beforecolor';
for i=1:4
    plot(t,sin(t-pi/3*(i-1)),'LineWidth',2)
end

ax3=nexttile();hold on;axis tight;box on
ax3.Title.String='aftercolor';
ax3.Title.FontWeight='bold';
ax3.Title.FontSize=25;
ax3.LineWidth=1;
ax3.LineStyleOrder={'-','--',':'};
ax3.LineStyleCyclingMethod='aftercolor';
for i=1:4
    plot(t,sin(t-pi/3*(i-1)),'LineWidth',2)
end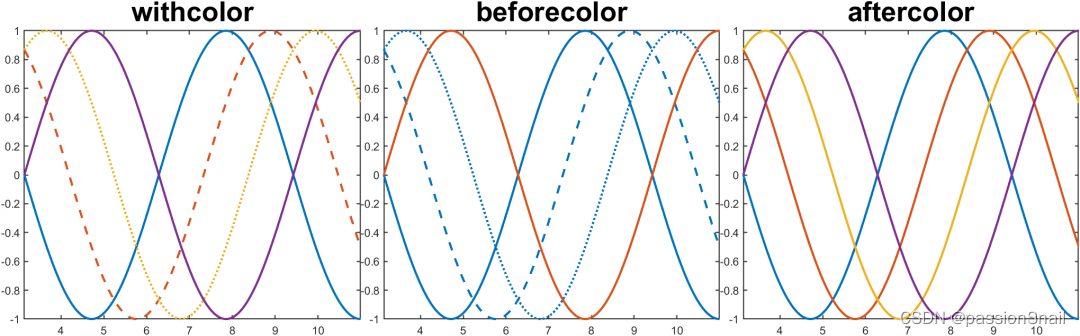
7 通过addStyle往app列表框增添图标
fig = uifigure('Position',[200,200,200,200]);
lb = uilistbox(fig,"Items",["Peppers","Nebula","Street"],'Position',[0,0,200,200]);

s1 = uistyle("Icon","peppers.png");
s2 = uistyle("Icon","ngc6543a.jpg");
s3 = uistyle("Icon","street1.jpg");

addStyle(lb,s1,"item",1);
addStyle(lb,s2,"item",2);
addStyle(lb,s3,"item",3);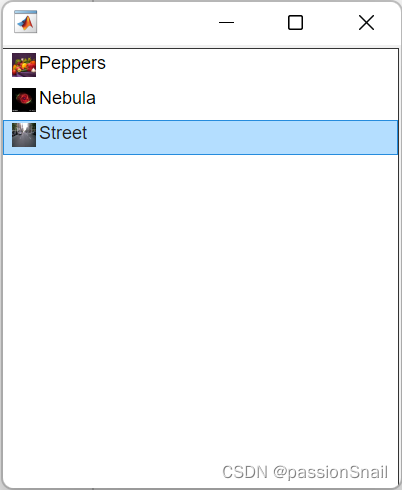
8 app uistack排序
创建五个具有不同标题和背景颜色的重叠面板。
f = figure;

a = uipanel(f,'Title','A','BackgroundColor','white');
b = uipanel(f,'Title','B','BackgroundColor','cyan');
c = uipanel(f,'Title','C','BackgroundColor','green');
d = uipanel(f,'Title','D','BackgroundColor','yellow');
e = uipanel(f,'Title','E','BackgroundColor','magenta');

a.Position = [0.35 0.50 0.30 0.35];
b.Position = [0.18 0.40 0.30 0.35];
c.Position = [0.08 0.21 0.30 0.35];
d.Position = [0.25 0.33 0.32 0.35];
e.Position = [0.30 0.27 0.30 0.35];
figChildren = f.Children
% figChildren =
%
%   5×1 Panel array:
%
%   Panel    (E)
%   Panel    (D)
%   Panel    (C)
%   Panel    (B)
%   Panel    (A)
将c d上移
comp = [c d];
uistack(comp,'up');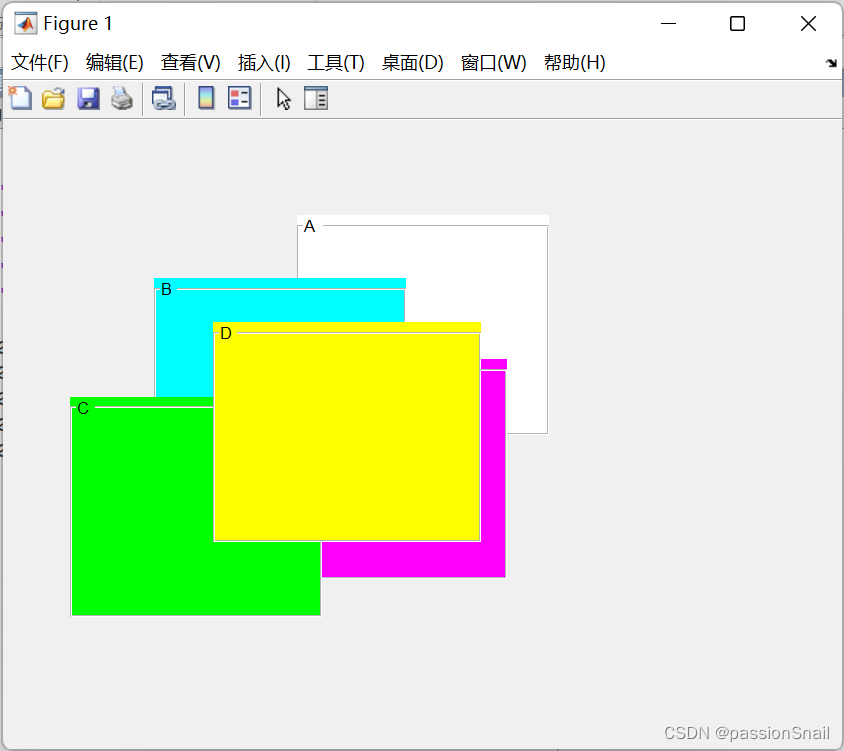
figChildren = f.Children
% figChildren =
%
%   5×1 Panel 数组:
%
%   Panel    (D)
%   Panel    (C)
%   Panel    (E)
%   Panel    (B)
% Panel (A)当然uistack可以设置参数为up,down,top,bottom。
9 uipanel border
通过BorderColor,BorderWidth可设置uibuttongroup及uipanel边框颜色和粗细:
f = figure();

a=uipanel(f,'Title','A','BorderColor',[.8,0,0],'BorderWidth',8);
b=uipanel(f,'Title','B','BorderColor',[0,0,.8],'BorderWidth',8);

a.Position = [0.2 0.4 0.7 0.4];
b.Position = [0.1 0.2 0.5 0.4];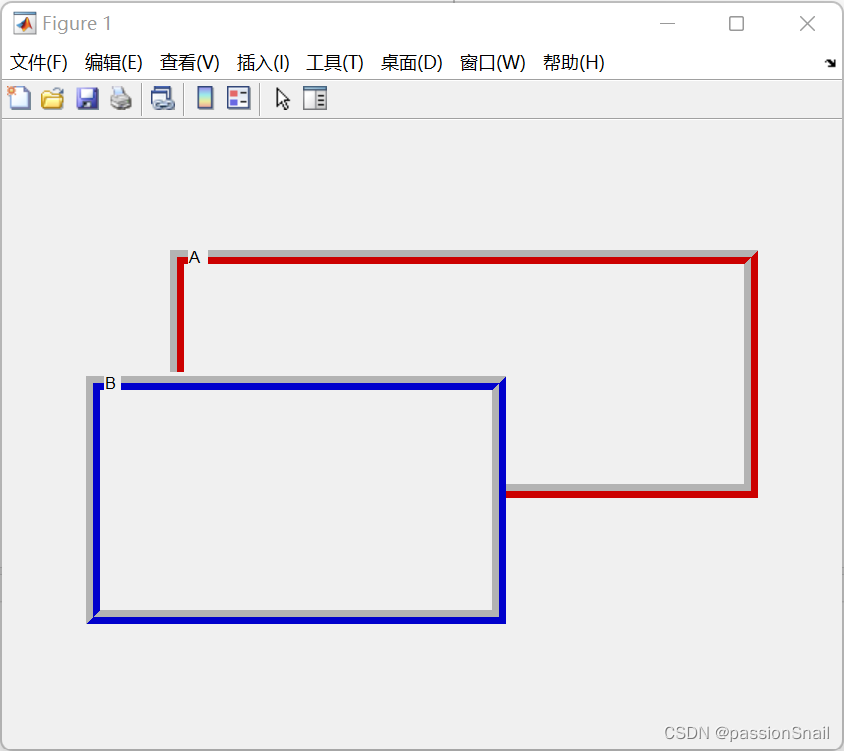
10 uiimage 动图及链接
fig = uifigure('Position',[100,100,300,300]);
im = uiimage(fig,'ImageSource','test.gif','Position',[0,0,200,200]);
im.ScaleMethod = 'scaledown';
将图像配置为点击时打开链接:
fig = uifigure;
im = uiimage(fig);
im.ImageSource = "membrane.png";
im.URL = "https://www.mathworks.com/";
im.Tooltip = "Go to www.mathworks.com";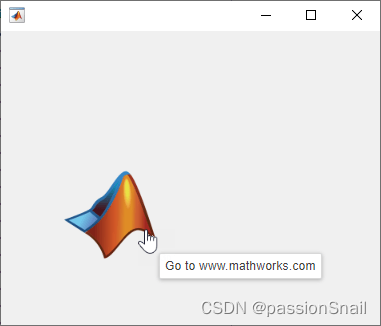
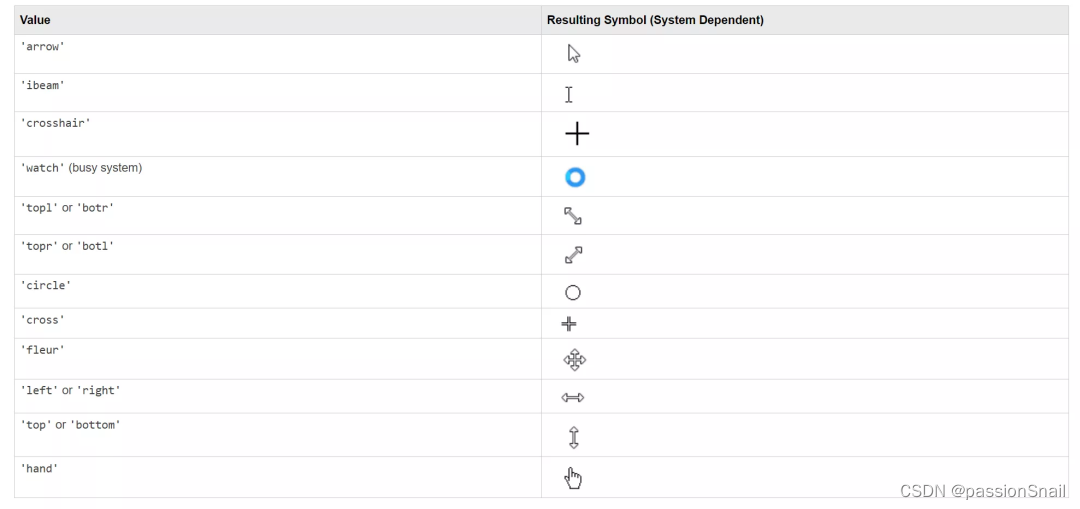
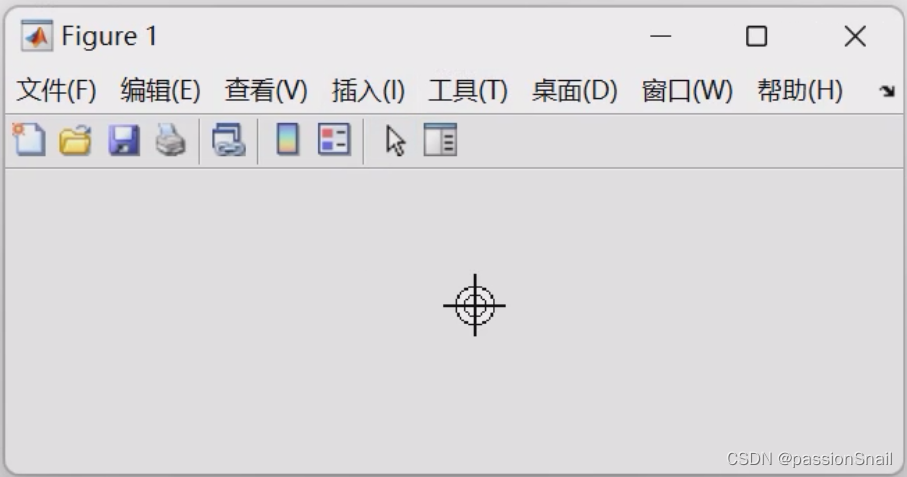
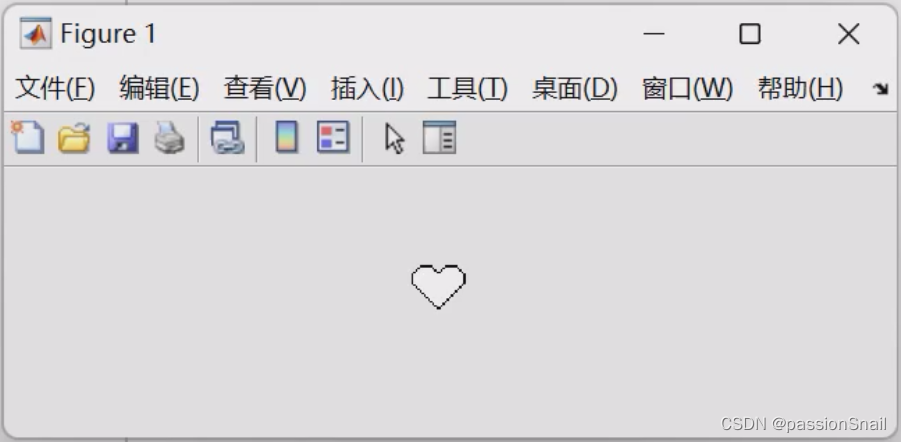
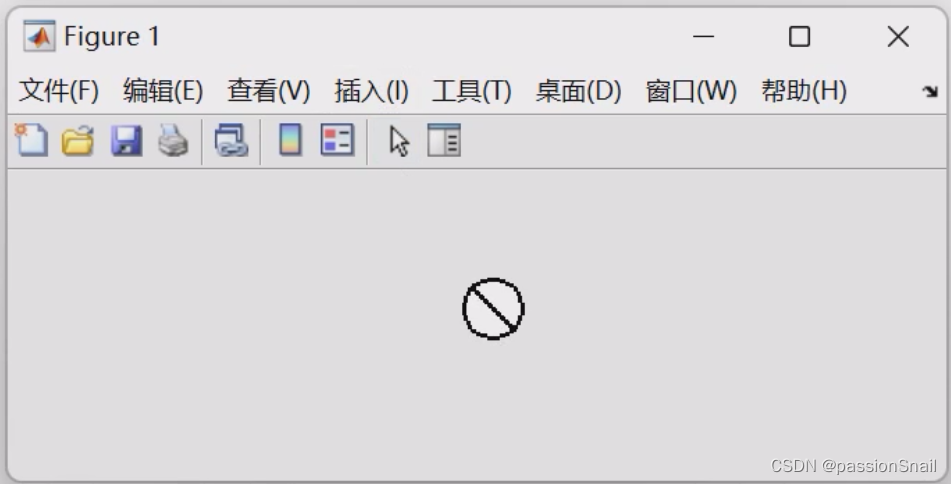
11 app uifigure 鼠标指针
uifigure 鼠标指针的鼠标指针可以自定义啦。
fig = uifigure;
fig.Pointer='watch';
光标能设置的类型不多:
12 默认不再安装本地文档
就是说本地默认不会再存储函数的介绍文档了,一些函数介绍需要联网才能看,以下在断网的时候分别在R2022b及R2023a命令行窗口运行:
doc plot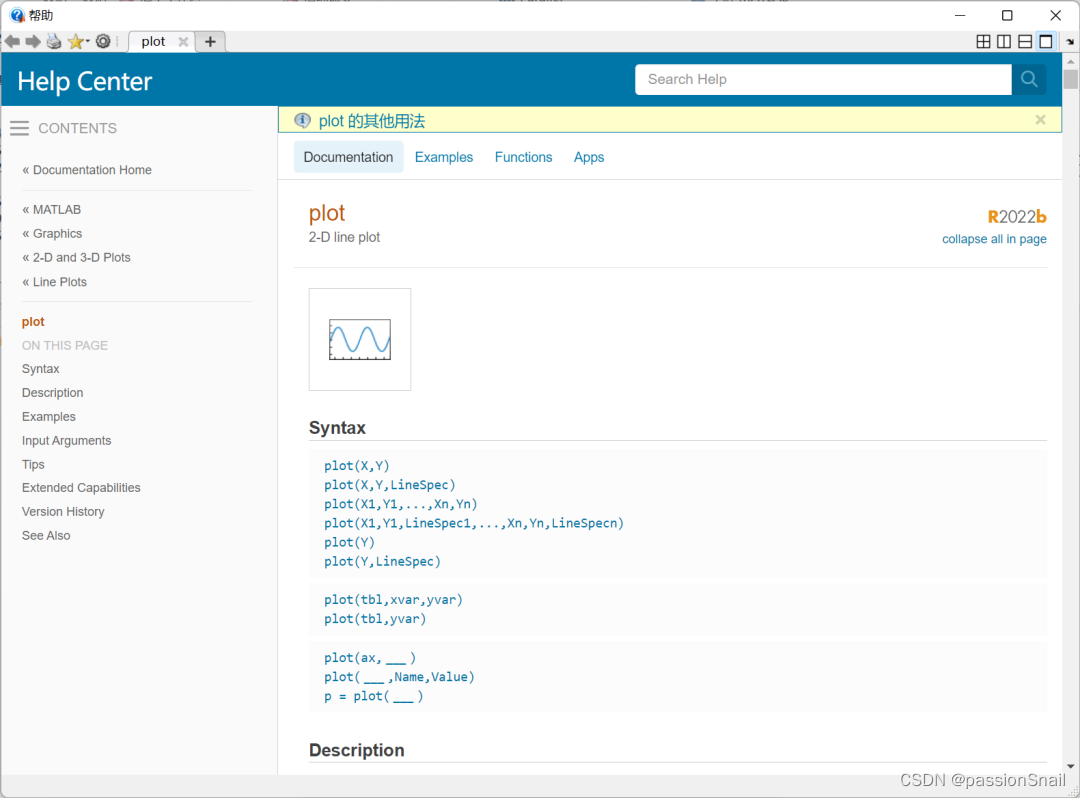
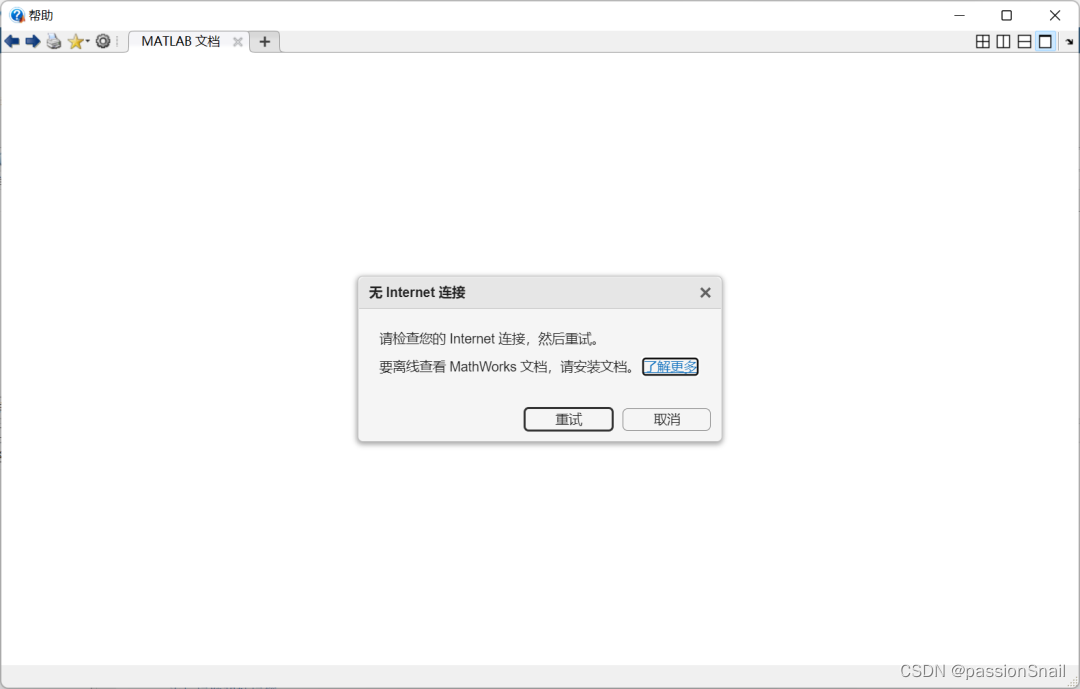
可以看到R2022b能够调出本地文档,R2023a只会提醒你没联网,有好有坏吧,好处是能减小MATLAB的安装大小,统计了一些常用的包都不安装文档可以节省10G左右空间,我装R2023a总体积15G左右。
当然如果经常在没网的地方默默敲代码,还是可以手动装文档的:https://ww2.mathworks.cn/help/install/ug/install-documentation.html
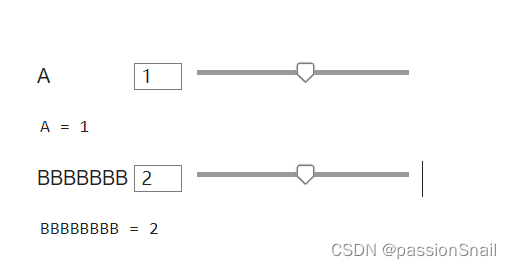
13 实时编辑器更新
实时编辑器增添了文件选择控件:

隐藏代码时对齐部分控件,这确实是没啥用的小更新,比如我控件名字BBBBBBB比A长很多也会自动对齐:
14 代码自动修复
逻辑复杂的代码就别想了,官方给的简单例子:假设编写了名为exampleScript.m的m文件,其中内容为:
x = [1 2 3]
for n = 1:3
    y(n) = x
end
命令行窗口运行如下代码就能获得问题列表:
issues=codeIssues("exampleScript")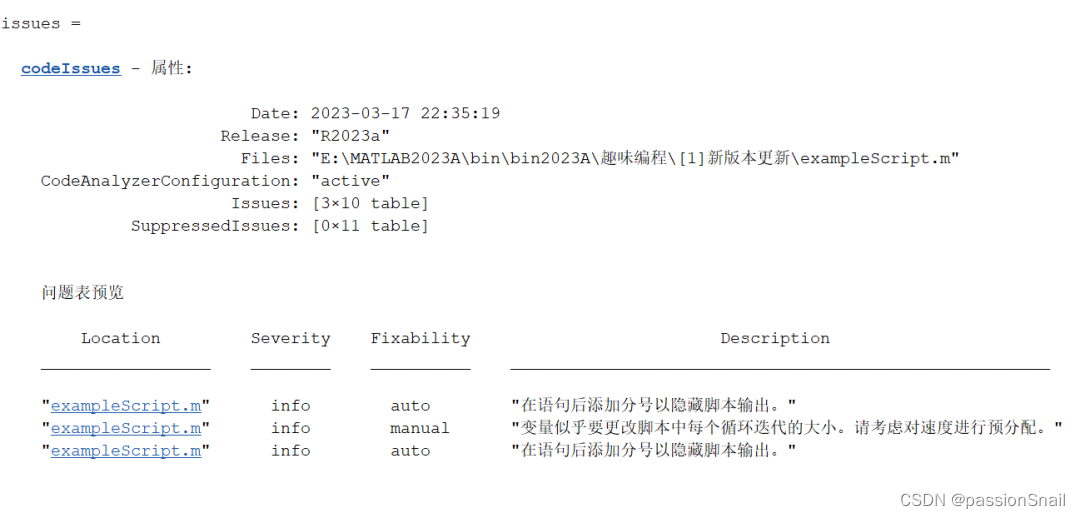
"exampleScript.m" info auto "在语句后添加分号以隐藏脚本输出。"
"exampleScript.m" info manual "变量似乎要更改脚本中每个循环迭代的大小。请考虑对速度进行预分配。"
"exampleScript.m" info auto "在语句后添加分号以隐藏脚本输出。"只有标注auto的才能自动修复: 再在命令行窗口运行如下代码:
fix(issues,"NOPTS")emmmmmmmmm发现MATLAB自动帮你加了俩分号哈哈哈哈哈哈,关于没预定义y管都没管。。。。。目前来看估计得等好几代后才会有真正有用的自动代码修复。。。
15 获取所有元素的组合
一个非常有用的函数combinations!
ID = ["A" "B" "C"];
color = ["red" "blue" "green"];
sz = ["small" "large"];

T = combinations(ID,color,sz)
运行结果:
T = 18×3 table
    ID      color       sz
    ___    _______    _______

    "A"    "red"      "small"
    "A"    "red"      "large"
    "A"    "blue"     "small"
    "A"    "blue"     "large"
    "A"    "green"    "small"
    "A"    "green"    "large"
    "B"    "red"      "small"
    "B"    "red"      "large"
    "B"    "blue"     "small"
    "B"    "blue"     "large"
    "B"    "green"    "small"
    "B"    "green"    "large"
    "C"    "red"      "small"
    "C"    "red"      "large"
    "C"    "blue"     "small"
    "C"    "blue"     "large"
    "C"    "green"    "small"
    "C"    "green"    "large"
16 数据去除NaN
一个很有用的函数fillmissing2,可以将二维数据中NaN部分数值用周围数的插值替代:
A = magic(5);
A(1,2) = NaN;
A(3:4,3:4) = NaN
构建的矩阵展示:
A = 5×5
    17   NaN     1     8    15
    23     5     7    14    16
     4     6   NaN   NaN    22
    10    12   NaN   NaN     3
    11    18    25     2     9
去除NaN值:
F = fillmissing2(A,"nearest")F = 5×5
17 1 1 8 15
23 5 7 14 16
4 6 7 22 22
10 12 25 3 3
11 18 25 2 9官方给了一个填充效果可视化的例子:
n = 51;
[x,y] = meshgrid(linspace(-2,2,n));
f = x.^2-y.^2;

NaNPercent = 0.05;
randEntries = randperm(n^2,round(NaNPercent*n^2));
f(randEntries) = NaN;

F = fillmissing2(f,"linear");
x = reshape(x,n^2,1);
y = reshape(y,n^2,1);
f = reshape(f,n^2,1);
F = reshape(F,n^2,1);

filledData = scatter3(x,y,F,24,"red","filled",...
                      MarkerEdgeColor="black");
hold on
originalData = scatter3(x,y,f,24,"green","filled",...
                        MarkerEdgeColor="black");
legend([filledData,originalData],...
       {"Filled","Original"},Location="north")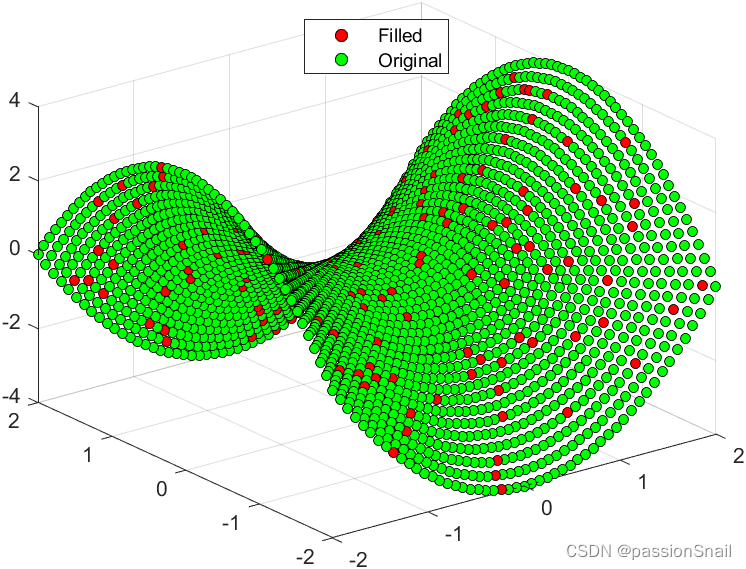
当然一维补全也有fillmissing函数:
x = [-4*pi:0.1:0, 0.1:0.2:4*pi];
A = sin(x);

A(A < 0.75 & A > 0.5) = NaN;

[F,TF] = fillmissing(A,'linear','SamplePoints',x);

scatter(x,A,'filled')
hold on
scatter(x(TF),F(TF),'filled')
legend('Original Data','Filled Data')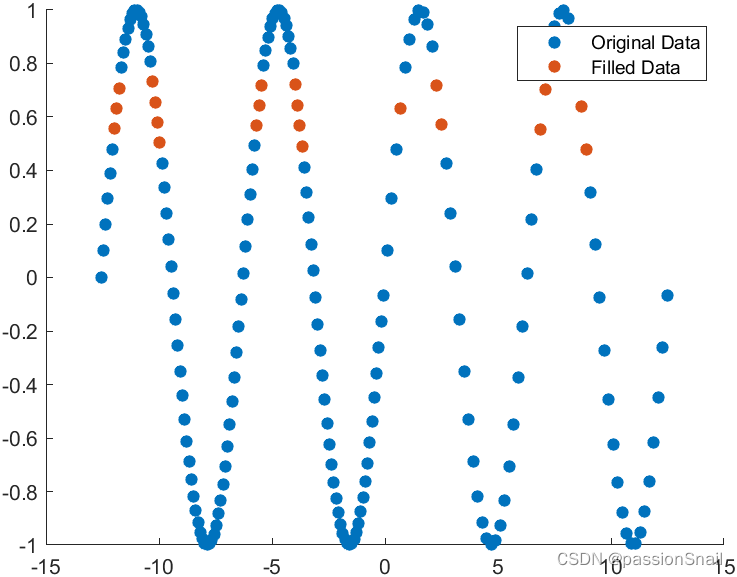
17 随机逻辑数组构建
目前来看还是比较鸡肋,以下两种写法说实话区别不大,可能也就速度略快:
tic
A1=randi([0 1],5)>0;
toc

tic
A2=randi([0 1],5,"logical");
toc
小数组时新写法创建速度是旧写法的两倍,但是对于比较大的数组来说,俩速度几乎完全一致。
完
以上是本次更新中比较有趣的内容,更的属实不少,反正才15G左右,这不赶快进行一波新版本的安装?


 2253
2253


 被折叠的 条评论
为什么被折叠?
被折叠的 条评论
为什么被折叠?
 到【灌水乐园】发言


