


欢迎来到 OpenLayers 的学习之旅!今天我们将深入探讨如何在 OpenLayers 地图中加载 GeoJSON 数据。你会看到代码是如何通过层层叠加的方式来建立这个功能,以及如何制定自定义样式来展示独特的 GeoJSON 数据。
目录
效果截图:

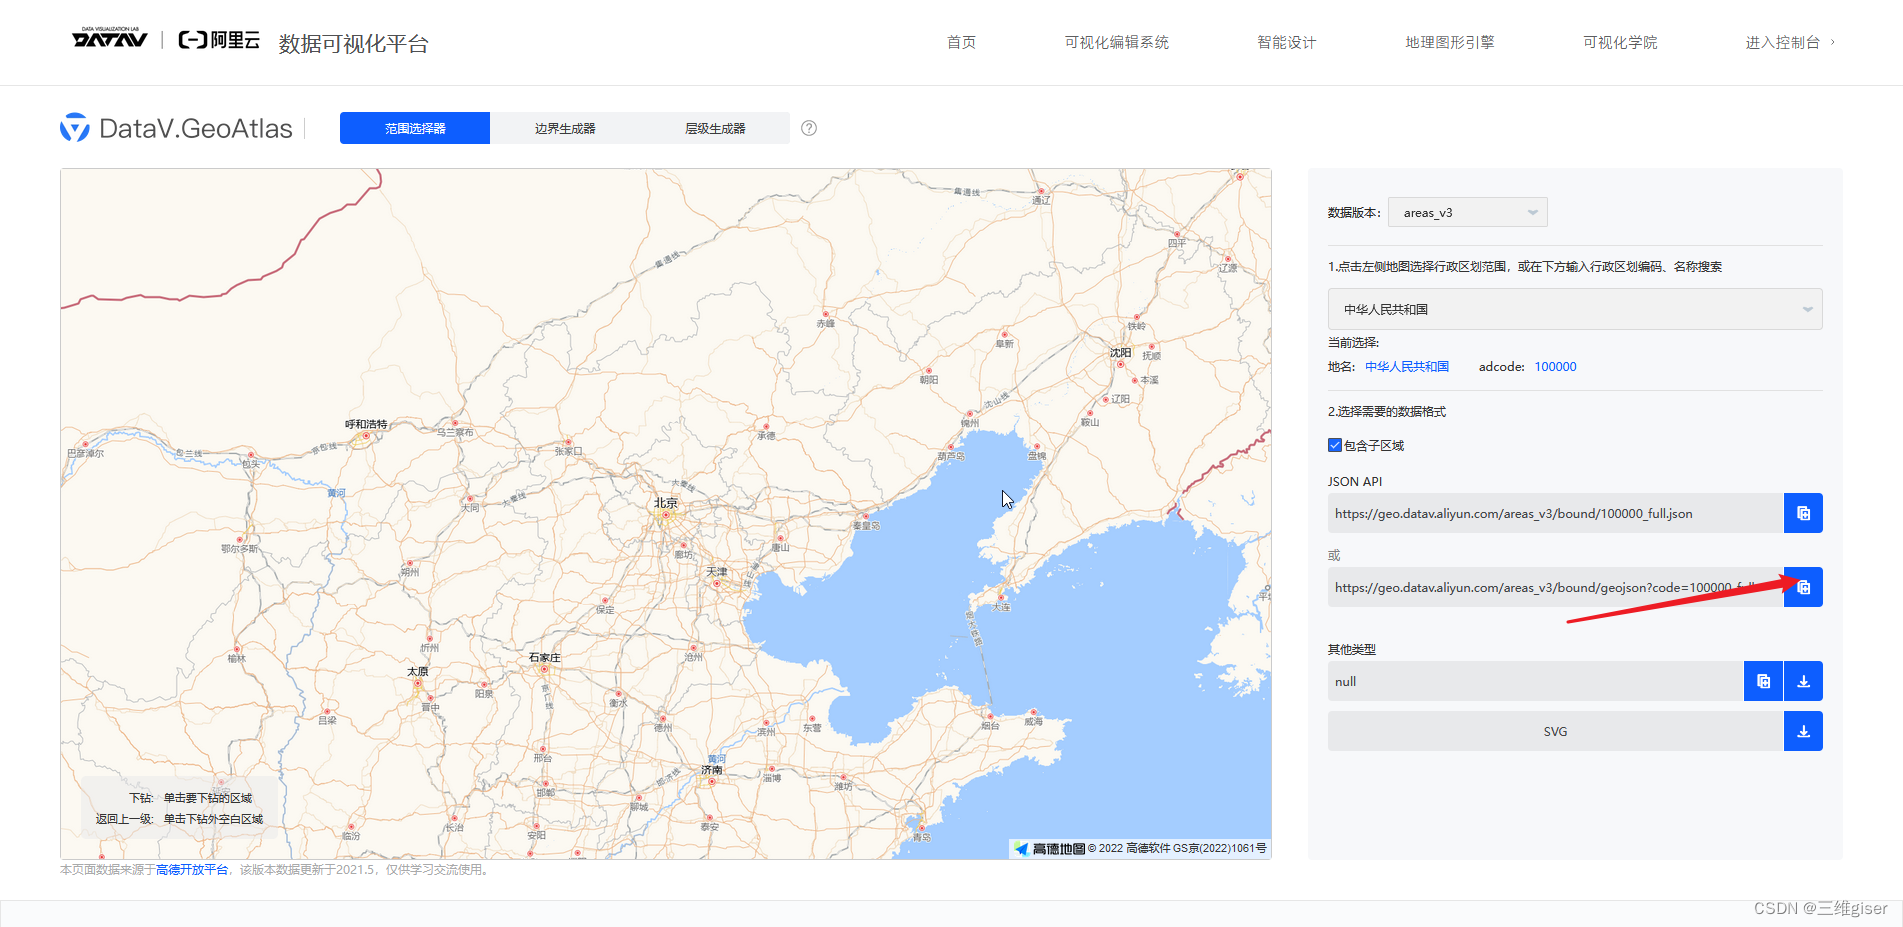
GeoJSON下载地址
阿里DataV官方数据
http://datav.aliyun.com/portal/school/atlas/area_selector
下载后\json文件,可改为geojson或者不改都可以加载。
代码分析
我们的示例代码是在 Vue.js 环境中实现的,因此你会看到地图组件的创建和初始化都封装在一个 Vue.js 组件内。不过记住,OpenLayers 的核心功能和 Vue.js 是可以分离的。相应的功能在任何 JavaScript 环境下都可以实现。
-
首先,我们定义了一个名为
mapComponent的 Vue 组件,并声明了一个 data 属性map来存储我们待会儿要初始化的OpenLayers Map对象。 -
当地图组件挂载(即插入到 DOM 中)后,会触发
mounted()钩子函数,然后执行我们的initMap()函数来初始化地图。
引入GeoJSON与Style
  import GeoJSON from "ol/format/GeoJSON";
  import { Style, Stroke, Fill } from "ol/style";
引入GeoJSON是为了加载数据,引入Style是为了自定义矢量图形样式。
创建GeoJSON图层、设置样式
        // 创建 GeoJSON 图层
        const geoJSONLayer = new VectorLayer({
          source: new VectorSource({
            url: "./static/geojson/100000.geojson",
            format: new GeoJSON()
          }),
          style: new Style({
            stroke: new Stroke({
              color: "#ff0000", // 描边红色
              width: 2 // 设置描边宽度为 1 像素
            }),
            fill: new Fill({
              color: "#ff000020" // 填充红色透明
            })
          })
        });
我是把geojson文件放在了vue的public文件夹下,然后url写的就是静态文件地址。
初始化地图
如下所示,initMap() 函数负责构建和配置地图。
initMap() {
  // 创建地图中心点坐标
  const centerCoordinate = [0, 0];

  // 初始化视图对象
  const view = new View({
    center: centerCoordinate,
    zoom: 3
  });

  // 创建 ArcGIS World Street Map 图层
  const arcGISLayer = new TileLayer({
    source: new XYZ({
      url: "https://server.arcgisonline.com/ArcGIS/rest/services/World_Street_Map/MapServer/tile/{z}/{y}/{x}"
    })
  });

  // 创建 GeoJSON 图层
  const geoJSONLayer = new VectorLayer({
    source: new VectorSource({
      url: "./static/geojson/100000.geojson",
      format: new GeoJSON()
    }),
    style: new Style({
      stroke: new Stroke({
        color: "#ff0000", // 描边红色
        width: 2 // 设置描边宽度为 2 像素
      }),
      fill: new Fill({
        color: "#ff000020" // 填充红色透明
      })
    })
  });

  // 初始化地图对象
  this.map = new Map({
    target: this.$refs.mapContainer,
    layers: [arcGISLayer, geoJSONLayer],
    view: view
  });
}
接下来,我们将详细解析这个函数中的各个部分。
视图对象初始化
在 OpenLayers 中,二维地图依赖 ol/View 对象来定义地图的初始视觉展示(例如:中心点和缩放级别)。
在这个例子中,视图的中心坐标被设定为 [0, 0],代表经度和纬度;并且初始的缩放级别设定为 3。
创建基础图层
我们的代码以 ArcGIS 的 World Street Map 作为地图的基础图层。因为ArcGIS瓦片地图国内可直接访问方便我们观看效果。
完整代码
<template>
  <div id="map-container" ref="mapContainer" class="map-container"></div>
</template>

<script>
  import "ol/ol.css";
  import { Map, View } from "ol";
  import TileLayer from "ol/layer/Tile";
  import XYZ from "ol/source/XYZ";
  import VectorLayer from "ol/layer/Vector";
  import VectorSource from "ol/source/Vector";
  import GeoJSON from "ol/format/GeoJSON";
  import { Style, Stroke, Fill } from "ol/style";
  export default {
    name: "MapComponent",
    data() {
      return {
        map: null
      };
    },
    mounted() {
      this.initMap();
    },
    methods: {
      /**
       * 初始化地图
       */
      initMap() {
        // 创建地图中心点坐标
        const centerCoordinate = [0, 0];

        // 初始化视图对象
        const view = new View({
          center: centerCoordinate,
          zoom: 3
        });

        // 创建ArcGIS World Street Map图层
        const arcGISLayer = new TileLayer({
          source: new XYZ({
            url: "https://server.arcgisonline.com/ArcGIS/rest/services/World_Street_Map/MapServer/tile/{z}/{y}/{x}"
          })
        });

        // 创建 GeoJSON 图层
        const geoJSONLayer = new VectorLayer({
          source: new VectorSource({
            url: "./static/geojson/100000.geojson",
            format: new GeoJSON()
          }),
          style: new Style({
            stroke: new Stroke({
              color: "#ff0000", // 描边红色
              width: 2 // 设置描边宽度为 1 像素
            }),
            fill: new Fill({
              color: "#ff000020" // 填充红色透明
            })
          })
        });

        // 初始化地图对象
        this.map = new Map({
          target: this.$refs.mapContainer,
          layers: [arcGISLayer, geoJSONLayer],
          view: view
        });
      }
    }
  };
</script>

<style>
  .map-container {
    width: 100vw;
    height: 100vh;
    margin: 0;
    padding: 0;
  }
</style>


 36
36


 被折叠的 条评论
为什么被折叠?
被折叠的 条评论
为什么被折叠?
 到【灌水乐园】发言


