


1、直接在编辑器中查看文件内容
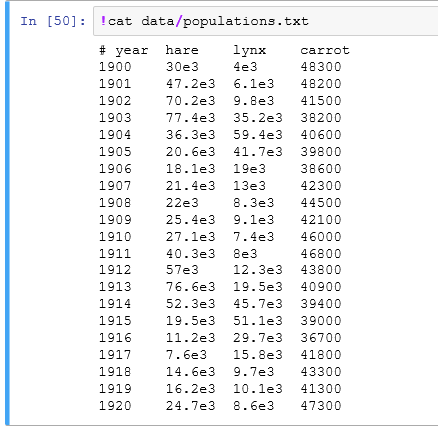
读取文件内容到data变量中:
data = np.loadtxt('data/populations.txt')
year, hares, lynxes, carrots = data.T # trick: columns to variablesfrom matplotlib import pyplot as plt
plt.axes([0.2, 0.1, 0.5, 0.8])
plt.plot(year, hares, year, lynxes, year, carrots)
plt.legend(('Hare', 'Lynx', 'Carrot'), loc=(1.05, 0.5)) <matplotlib.legend.Legend at 0x10f8bc710>
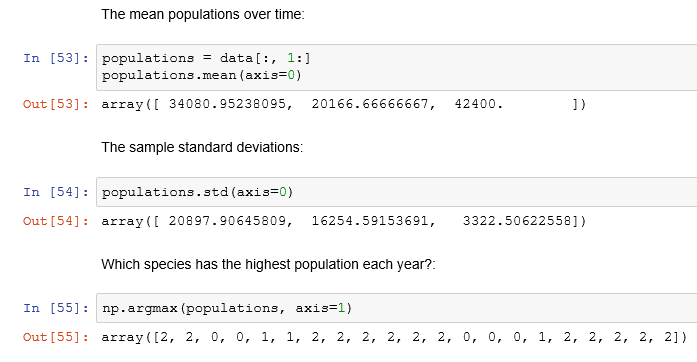
再进行一些计算,相应的计算可参考前一篇文章
2、读取图片
from IPython.display import Image
Image(filename='images/numpy_image.png') 最低0.47元/天 解锁文章


 692
692


 被折叠的 条评论
为什么被折叠?
被折叠的 条评论
为什么被折叠?
 到【灌水乐园】发言


