


 本文介绍了SpringBoot Actuator模块,用于生产环境的监控和管理。Actuator提供了丰富的端点,如health和info,用于健康检查和应用信息展示。SpringBoot 2.0引入了Micrometer,增强了指标监控功能。文章详细讲解了Actuator的基本使用、端点的启用与暴露、健康和指标信息,以及如何定制端点。此外,还探讨了通过SpringBootAdmin实现可视化的监控解决方案。
SpringBoot - Actuator指标监控
本节学习SpringBoot使用Actuator模块进行指标监控功能。
1. SpringBoot Actuator概述
1.1 Actuator简介
Spring Boot includes a number of additional features to help you monitor and manage your application when you push it to production. You can choose to manage and monitor your application by using HTTP endpoints or with JMX. Auditing, health, and metrics gathering can also be automatically applied to your application.
Spring Boot Actuator: Production-ready Features - Spring
SpringBoot自带监控功能Actuator,可以帮助实现对程序内部运行情况监控,比如监控状况、Bean加载情况、环境变量、日志信息、线程信息等。
Spring Boot & Actuator - 简书/十毛tenmao
未来每一个微服务在云上部署以后,我们都需要对其进行监控、追踪、审计、控制等。SpringBoot就抽取了Actuator模块,使得我们每个微服务快速引用即可活动生产级别的应用监控、审计等功能。
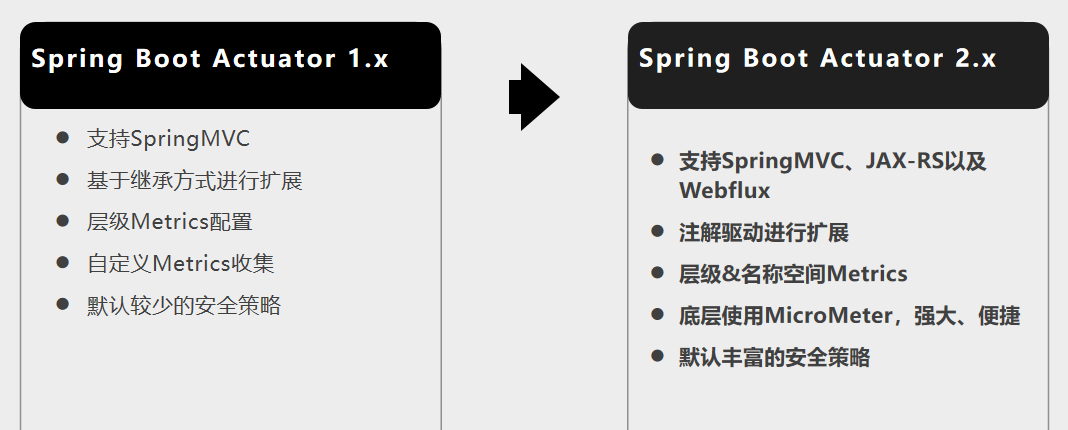
1.2 SpringBoot Actuator 2.0新版本特性
- SpringBoot2.0对端点进行了许多改进,所有HTTP端点现在都在
/actuator路径下暴露; - 默认HTTP端点仅暴露
info和health,如需更改默认设置需指定management.endpoints.web.exposure.include属性; - 优化了端点返回的JSON数据,很多端点现在都可以返回JSON,可以更好地反映底层数据;
- SpringBoot2.0使用Micrometer进行指标监控功能,不再使用自己的指标监控API;
- Micrometer提供更强大、便捷的指标监控功能,可以对接其他指标监控平台,同时集成了JVM指标(包括CPU,内存,线程和GC)等。
更多变化和详细信息可以参阅 Spring Boot 2.0 Release Notes 。
2. 指标监控功能基本使用
2.1 导入模块starter
Maven导入Actuator模块starter:
<dependency>
    <groupId>org.springframework.boot</groupId>
    <artifactId>spring-boot-starter-actuator</artifactId>
    <!-- 使用SpringBoot的版本管理机制 -->
</dependency>
引入的依赖:

2.2 基本使用方式
Actuator可以通过两种方式进行访问:HTTP方式和JMX方式。
- HTTP方式(常用):Actuator默认在
/actuator路径下暴露端点,默认只暴露health和info端点,访问端点可以获取指标监控的详细JSON数据:

- JMX方式:可以使用JConsole或者VisualVM等工具远程连接Actuator获取指标监控数据:

3. 端点
Actuator的核心就是端点(Endpoint),每一个端点都代表着监控某一项数据。
Actuator endpoints let you monitor and interact with your application. Spring Boot includes a number of built-in endpoints and lets you add your own. For example, the
healthendpoint provides basic application health information.
Endpoints - Spring/Spring Boot Actuator: Production-ready Features
Actuator支持的端点一览(详细信息请参照 Spring官方文档 ):
| 端点ID | 作用 |
|---|---|
auditevents |
暴露当前应用的审计事件信息。需要一个AuditEventRepositorybean |
beans |
显示应用中所有Spring bean的完整列表 |
caches |
暴露可用的缓存 |
conditions |
显示自动配置信息,包括注入和未注入容器的组件以及注入和未被注入的原因 |
configprops |
显示所有标注@ConfigurationProperties的组件信息的整理列表 |
env |
显示所有环境变量 |
flyway |
显示已应用的所有Flyway数据库迁移信息,需要一个或多个Flywaybeans |
health |
显示应用的健康信息 |
httptrace |
显示请求的跟踪信息,默认显示前100条请求,需要一个HttpTraceRepositorybean |
info |
显示指定的应用信息 |
integrationgraph |
显示Spring集成图,需要spring-integration-core依赖 |
loggers |
显示和修改应用中的日志记录配置 |
liquibase |
显示已应用的所有Liquibase数据库迁移信息,需要一个或多个Liquibasebeans |
metrics |
显示当前应用的系统度量指标信息 |
mappings |
显示当前应用的所有请求路径的完整列表 |
scheduledtasks |
显示应用中的计划任务 |
sessions |
查找和删除Spring Session支持的用户会话,需要使用Spring Session的基于Servlet的Web应用程序 |
shutdown |
关闭应用,要求endpoints.shutdown.enabled设置为true,默认为false |
startup |
显示ApplicationStartup收集的启动步骤数据。 需要使用BufferingApplicationStartup配置SpringApplication |
threaddump |
显示系统线程转储信息 |
如果当前应用是Web应用程序(SpringMVC、SpringWebFlux或者Jersey),还支持下列端点:
| 端点ID | 作用 |
|---|---|
heapdump |
获取hprof堆转储文件,需要HotSpot JVM |
jolokia |
通过HTTP方式暴露JMX bean(当Jolokia在类路径上时,不适用于WebFlux),需要jolokia-core依赖。 |
logfile |
获取日志文件的内容(如果已经设置了logging.file.name或者logging.file.path属性),支持使用HTTP Range标头来查找日志文件的部分内容 |
prometheus |
以Prometheus服务器可以抓取的格式暴露指标信息,需要micrometer-registry-prometheus依赖 |
3.1 端点的开启/禁用与暴露
除了shutdown端点默认关闭之外,其他的端点都是默认开启的,需要关闭某个端点,可以在SpringBoot配置文件中指定management.endpoint.<id>.enabled属性为false。
可以指定management.endpoints.enabled-by-default属性为true以开启所有端点(shutdown端点也会被开启,为了安全建议手动关闭)。
指定management.endpoints.web.exposure.include属性为'*'以在HTTP暴露所有端点,方便我们使用HTTP方式进行指标监控。
指定management.endpoints.web.exposure.exclude属性'<端点名称>'以隐藏端点,最好还是关闭端点。
management:
  # endpoints是对所有端点的全局配置
  endpoints:
    web:
      exposure:
        include: '*'
    enabled-by-default: true
  # endpoint是对某个端点的详细配置
  endpoint:
    shutdown:
      enabled: false
3.2 健康信息
访问/actuator/health及其路径下的端点查看健康信息来检查正在运行的应用的健康状态。当系统出现故障时,监控系统通常将会使用这些信息来进行提醒与警告。
健康信息的端点使用management.endpoint.health.show-details属性和management.endpoint.health.show-components属性进行配置,
management.endpoint.health.show-details属性指定是否显示所有组件的健康程度,management.endpoint.health.show-components属性指定是否显示所有组件的详细信息。
下列是这些属性的可选值:
| 可选值 | 描述 |
|---|---|
never |
详细信息永不展示 |
when-authorized |
详细信息仅会向授权用户展示。 可以使用management.endpoint.health.roles属性配置授权角色 |
always |
详细信息会向所有用户展示 |
健康信息端点一般用在云平台,平台会定时检查应用的健康状况,重要的几点:
- 健康信息端点返回的结果,应该是对所有组件(应用状态,数据库状态,硬盘空间,网络延迟等)进行一系列健康检查后的一个汇总报告;
- 很多健康检查的配置已经自动配置了,比如数据库、redis等;
- 可以很容易添加自定
 最低0.47元/天 解锁文章


 1392
1392


 被折叠的 条评论
为什么被折叠?
被折叠的 条评论
为什么被折叠?
 到【灌水乐园】发言


