


目录
目标:
logstach 配置文件读取,推送到elasticsearch,我希望可以设置一个索引,然后再kibana里面查看
环境
elk 版本:8.8.1
系统 :win11
走的弯路,不知道从哪个大神哪里copy来的
input {
  file {
    path => "D:\logs\access.log"
    start_position => "beginning"
  }
}

filter {
  if [path] =~ "access" {
    mutate { replace => { "type" => "apache_access" } }
    grok {
      match => { "message" => "%{COMBINEDAPACHELOG}" }
    }
  }
  date {
    match => [ "timestamp" , "dd/MMM/yyyy:HH:mm:ss Z" ]
  }
}

output {
  elasticsearch {
    hosts => ["https://localhost:9200"]
	 index => "laoxiang-logstash"  #索引名称,从哪位大佬哪里copy过来的
    user => "elastic"
    password => "RO8tbN0X4ge9lxbdTNbk"
	cacert => "D:\aDriverDownloads\ElasticSearch\elasticsearch-8.8.1-windows-x86_64\elasticsearch-8.8.1\config\certs\http_ca.crt"

  }
  stdout { codec => rubydebug }
}
kibana提示
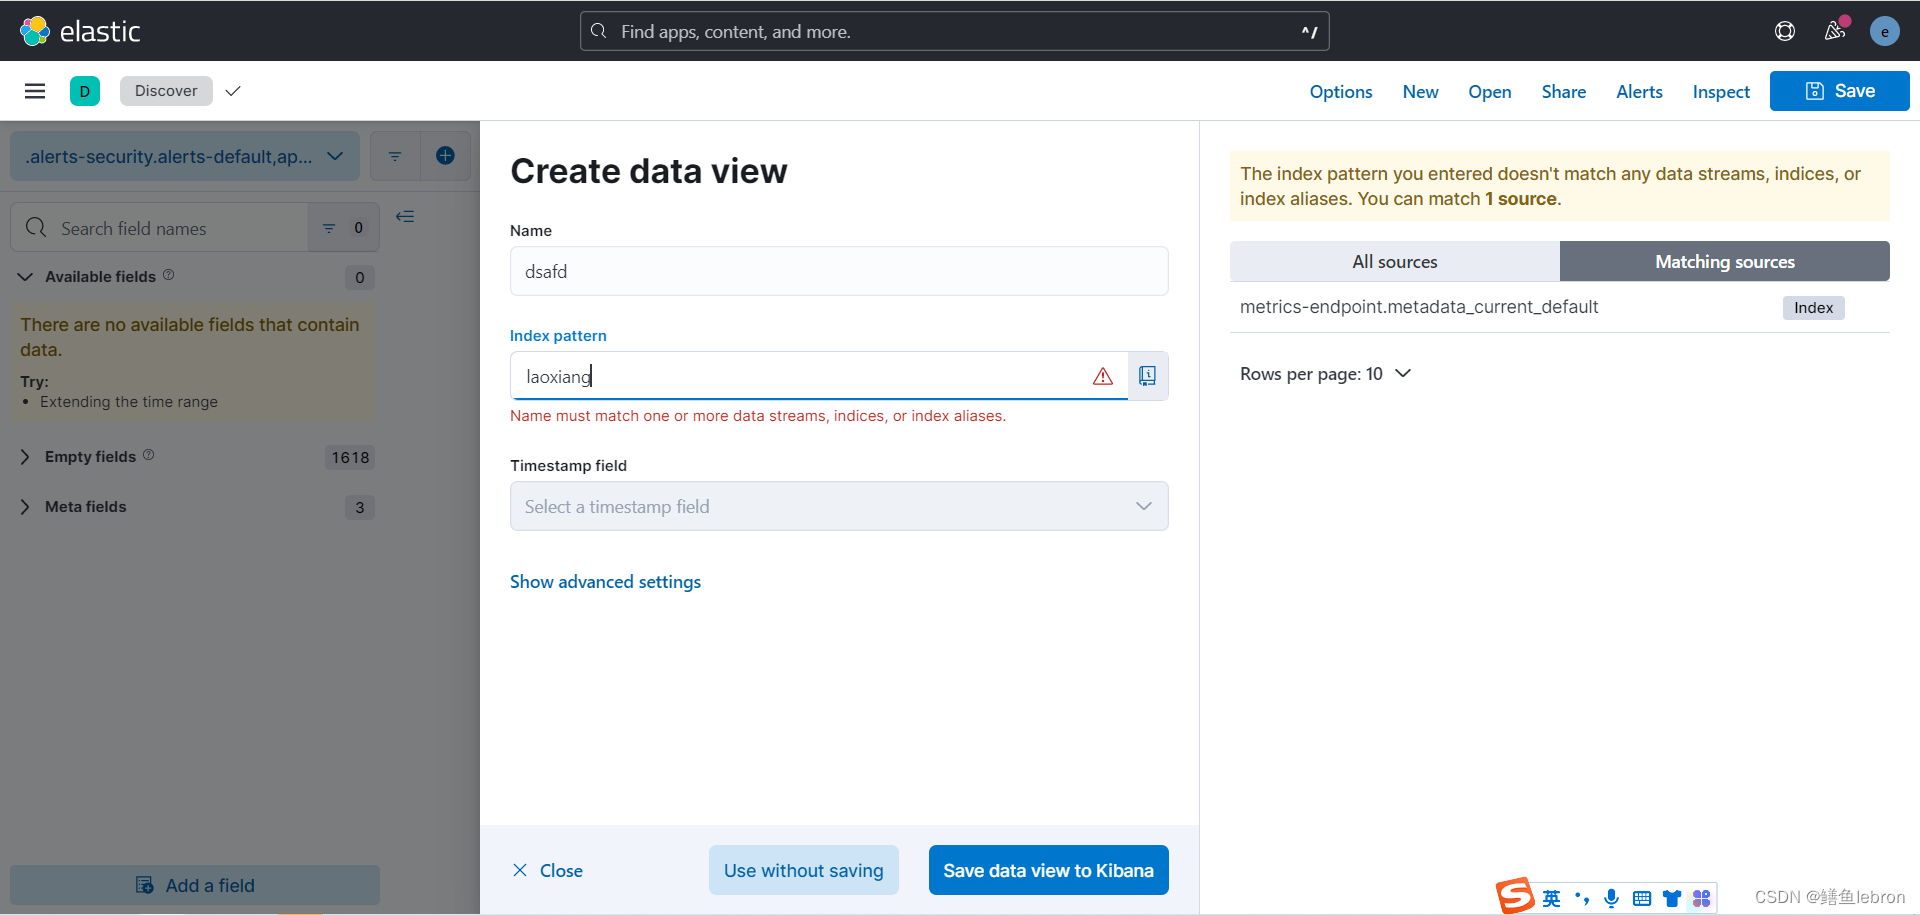
logstach控制台提示:
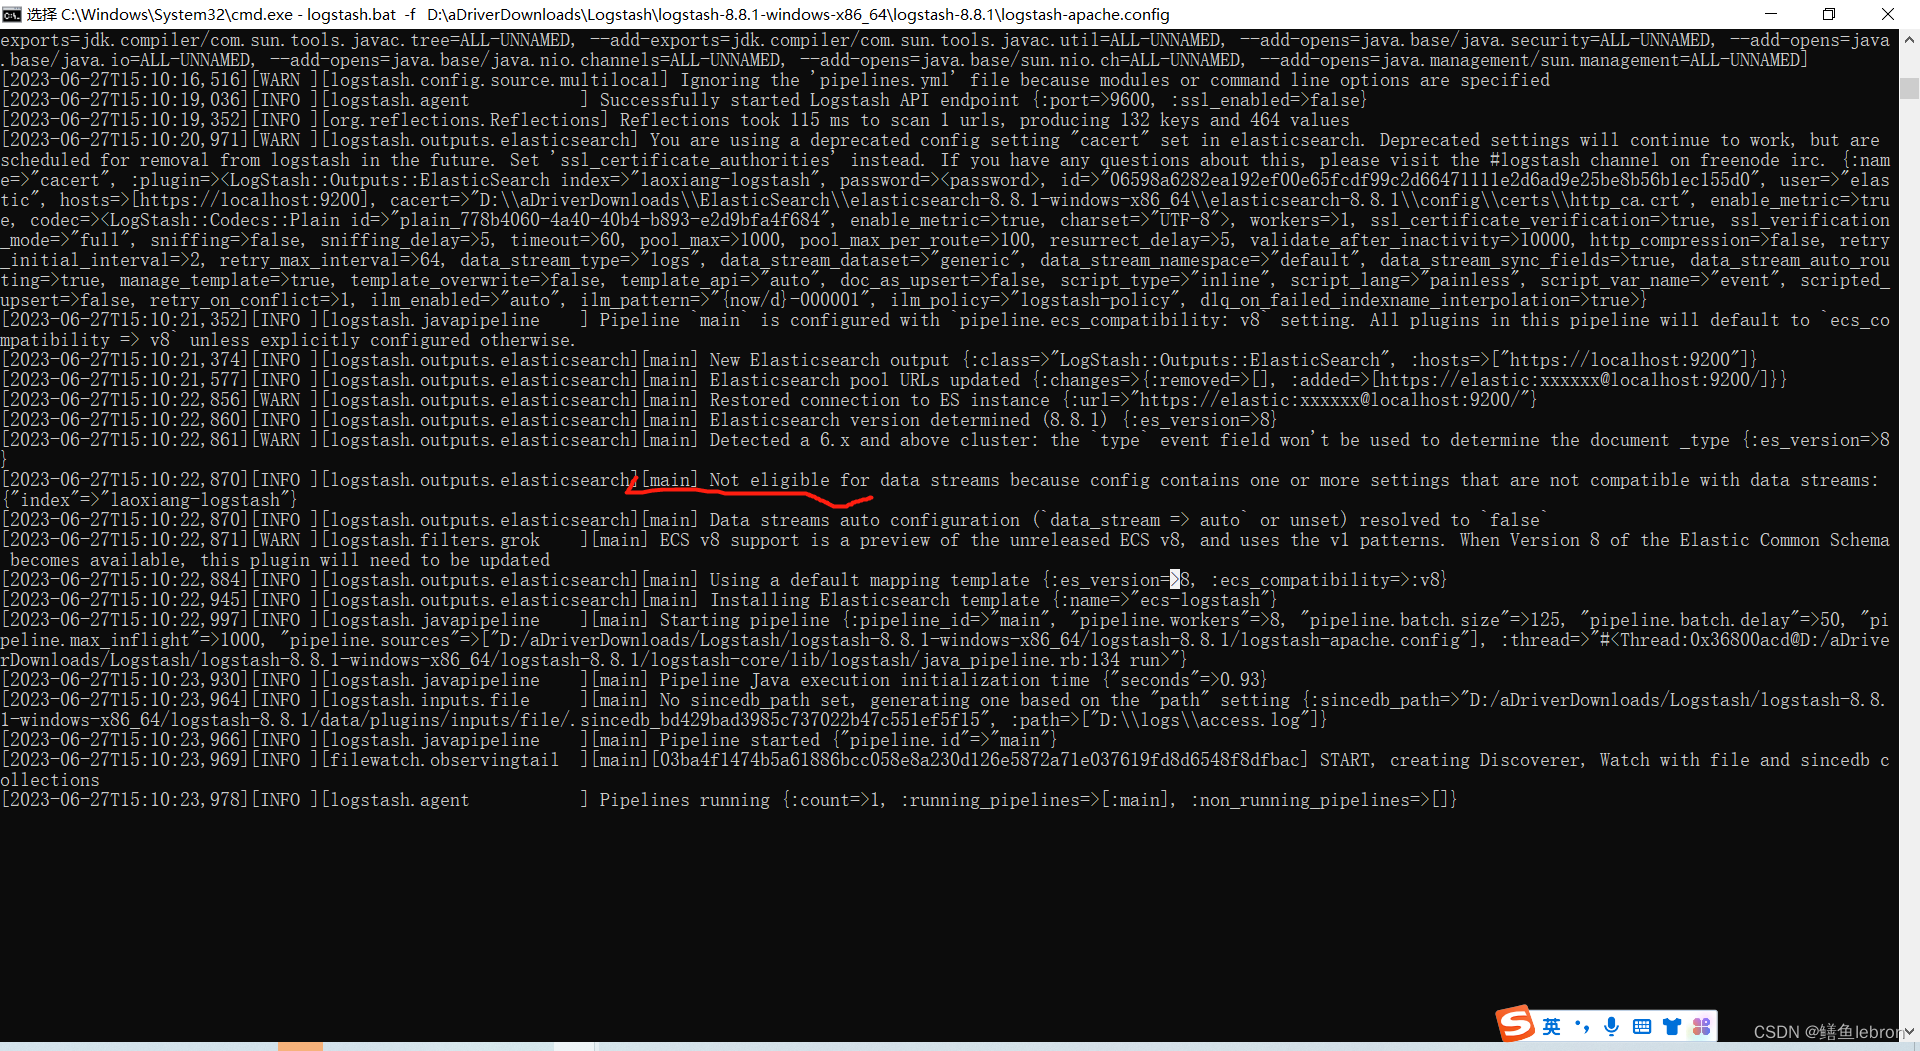
Not eligible for data streams because config contains one or more settings that are not compatible with data streams: {"index"=>"laoxiang-logstash"}
重新规划,重见光明
查看官方文档 Parsing Logs with Logstash | Logstash Reference [8.8] | Elastic
按照流程一步步执行;
第一步:部署filebeat
部署步骤介绍:Download Filebeat • Lightweight Log Analysis | Elastic
下载地址:https://artifacts.elastic.co/downloads/beats/filebeat/filebeat-8.8.2-windows-x86_64.msi
编写配置文件:cd D:\aDriverDownloads\Filebeat\filebeat-8.8.1-windows-x86_64\filebeat-8.8.1-windows-x86_64
新增文件:filebeat.yaml 文件内容如下:
filebeat.inputs:- type: log paths: - /path/to/file/logstash-tutorial.log output.logstash: hosts: ["localhost:5044"]启动filebeat
./filebeat -e -c filebeat.yml -d "publish"会出现这样的

第二步:部署 Logstash
官方文档:Download Logstash Free | Get Started Now | Elastic
下载 https://artifacts.elastic.co/downloads/logstash/logstash-8.8.1-windows-x86_64.zip
解压到任意文件夹
Logstach 使用介绍:采用filebeat
Parsing Logs with Logstash | Logstash Reference [8.8] | Elastic
在目录:D:\aDriverDownloads\Logstash\logstash-8.8.1-windows-x86_64\logstash-8.8.1 新建配置文件:logstash-apache.config
文件内容
input {
    beats {
        port => "5044"
    }
}
filter {
    grok {
#这里的解析是针对自己的日志文件,如果要验证自己的日志文件能否解析出来,可以去http://localhost:5601/app/dev_tools#/grokdebugger 解析测试
        match => { "message" => "(?m)^%{TIMESTAMP_ISO8601:createTime}%{SPACE}\[%{DATA:threadName}\]%{SPACE}%{LOGLEVEL:LEVEL}%{SPACE}%{JAVACLASS:javaClass}%{SPACE}-%{GREEDYDATA:msg}"}

    }
}
output {
    stdout { codec => rubydebug }
	elasticsearch {
      hosts => [ "localhost:9200" ]
        user => "elastic"
        password => "=y0WI+_UBDiwnSOsdZGQ"

        #你的SSL证书地址,我已经把es的ssl取消了,不需要用https
        #cacert => "D:\aDriverDownloads\ElasticSearch\elasticsearch-8.8.1-windows-x86_64\elasticsearch-8.8.1\config\certs\http_ca.crt"

    }
}
启动命令:
logstash.bat -f ./logstash-apache.config --config.reload.automatic需要等待,就会出现类似这种

第三步:部署 elasticsearch
官方流程:Install Elasticsearch with .zip on Windows | Elasticsearch Guide [8.8] | Elastic
下载winodws版本
https://artifacts.elastic.co/downloads/elasticsearch/elasticsearch-8.8.1-windows-x86_64.zip
解压到任意地方
启动 cmd到 bin目录
elasticsearch.bat取消了https,elasticsearch配置文件(路径:"D:\aDriverDownloads\ELK\ElasticSearch\elasticsearch-8.8.1-windows-x86_64\elasticsearch-8.8.1\config\elasticsearch.yml")如下:
# ======================== Elasticsearch Configuration =========================
#
# NOTE: Elasticsearch comes with reasonable defaults for most settings.
#       Before you set out to tweak and tune the configuration, make sure you
#       understand what are you trying to accomplish and the consequences.
#
# The primary way of configuring a node is via this file. This template lists
# the most important settings you may want to configure for a production cluster.
#
# Please consult the documentation for further information on configuration options:
# https://www.elastic.co/guide/en/elasticsearch/reference/index.html
#
# ---------------------------------- Cluster -----------------------------------
#
# Use a descriptive name for your cluster:
#
#cluster.name: my-application
#
# ------------------------------------ Node ------------------------------------
#
# Use a descriptive name for the node:
#
#node.name: node-1
#
# Add custom attributes to the node:
#
#node.attr.rack: r1
#
# ----------------------------------- Paths ------------------------------------
#
# Path to directory where to store the data (separate multiple locations by comma):
#
#path.data: /path/to/data
#
# Path to log files:
#
#path.logs: /path/to/logs
#
# ----------------------------------- Memory -----------------------------------
#
# Lock the memory on startup:
#
#bootstrap.memory_lock: true
#
# Make sure that the heap size is set to about half the memory available
# on the system and that the owner of the process is allowed to use this
# limit.
#
# Elasticsearch performs poorly when the system is swapping the memory.
#
# ---------------------------------- Network -----------------------------------
#
# By default Elasticsearch is only accessible on localhost. Set a different
# address here to expose this node on the network:
#
#network.host: 192.168.0.1
#
# By default Elasticsearch listens for HTTP traffic on the first free port it
# finds starting at 9200. Set a specific HTTP port here:
#
#http.port: 9200
#
# For more information, consult the network module documentation.
#
# --------------------------------- Discovery ----------------------------------
#
# Pass an initial list of hosts to perform discovery when this node is started:
# The default list of hosts is ["127.0.0.1", "[::1]"]
#
#discovery.seed_hosts: ["host1", "host2"]
#
# Bootstrap the cluster using an initial set of master-eligible nodes:
#
#cluster.initial_master_nodes: ["node-1", "node-2"]
#
# For more information, consult the discovery and cluster formation module documentation.
#
# ---------------------------------- Various -----------------------------------
#
# Allow wildcard deletion of indices:
#
#action.destructive_requires_name: false

#----------------------- BEGIN SECURITY AUTO CONFIGURATION -----------------------
#
# The following settings, TLS certificates, and keys have been automatically
# generated to configure Elasticsearch security features on 20-06-2023 03:47:11
#
# --------------------------------------------------------------------------------

# Enable security features
xpack.security.enabled: false  #原始文件是true

xpack.security.enrollment.enabled: false #原始文件是true

# Enable encryption for HTTP API client connections, such as Kibana, Logstash, and Agents
xpack.security.http.ssl:
  enabled: false #原始文件是true
  keystore.path: certs/http.p12

# Enable encryption and mutual authentication between cluster nodes
xpack.security.transport.ssl:
  enabled: false
  verification_mode: certificate
  keystore.path: certs/transport.p12
  truststore.path: certs/transport.p12
# Create a new cluster with the current node only
# Additional nodes can still join the cluster later
cluster.initial_master_nodes: ["DESKTOP-725BTEG"]

# Allow HTTP API connections from anywhere
# Connections are encrypted and require user authentication
http.host: 0.0.0.0
ingest.geoip.downloader.enabled: false
# Allow other nodes to join the cluster from anywhere
# Connections are encrypted and mutually authenticated
#transport.host: 0.0.0.0

#----------------------- END SECURITY AUTO CONFIGURATION -------------------------
第四步:部署 kibana
官方流程 :Install Kibana on Windows | Kibana Guide [8.8] | Elastic
下载:
https://artifacts.elastic.co/downloads/kibana/kibana-8.8.1-windows-x86_64.zip
解压到任意目录,然后启动 cmd 到 bin目录
kibana.bat取消了https之后,kibana的配置文件(路径:"D:\aDriverDownloads\ELK\Kibana\kibana-8.8.1-windows-x86_64\kibana-8.8.1\config\kibana.yml")如下:
# For more configuration options see the configuration guide for Kibana in
# https://www.elastic.co/guide/index.html

# =================== System: Kibana Server ===================
# Kibana is served by a back end server. This setting specifies the port to use.
#server.port: 5601

# Specifies the address to which the Kibana server will bind. IP addresses and host names are both valid values.
# The default is 'localhost', which usually means remote machines will not be able to connect.
# To allow connections from remote users, set this parameter to a non-loopback address.
#server.host: "localhost"

# Enables you to specify a path to mount Kibana at if you are running behind a proxy.
# Use the `server.rewriteBasePath` setting to tell Kibana if it should remove the basePath
# from requests it receives, and to prevent a deprecation warning at startup.
# This setting cannot end in a slash.
#server.basePath: ""

# Specifies whether Kibana should rewrite requests that are prefixed with
# `server.basePath` or require that they are rewritten by your reverse proxy.
# Defaults to `false`.
#server.rewriteBasePath: false

# Specifies the public URL at which Kibana is available for end users. If
# `server.basePath` is configured this URL should end with the same basePath.
#server.publicBaseUrl: ""

# The maximum payload size in bytes for incoming server requests.
#server.maxPayload: 1048576

# The Kibana server's name. This is used for display purposes.
#server.name: "your-hostname"

# =================== System: Kibana Server (Optional) ===================
# Enables SSL and paths to the PEM-format SSL certificate and SSL key files, respectively.
# These settings enable SSL for outgoing requests from the Kibana server to the browser.
#server.ssl.enabled: false
#server.ssl.certificate: /path/to/your/server.crt
#server.ssl.key: /path/to/your/server.key

# =================== System: Elasticsearch ===================
# The URLs of the Elasticsearch instances to use for all your queries.
#elasticsearch.hosts: ["http://localhost:9200"]

# If your Elasticsearch is protected with basic authentication, these settings provide
# the username and password that the Kibana server uses to perform maintenance on the Kibana
# index at startup. Your Kibana users still need to authenticate with Elasticsearch, which
# is proxied through the Kibana server.
#elasticsearch.username: "kibana_system"
#elasticsearch.password: "pass"

# Kibana can also authenticate to Elasticsearch via "service account tokens".
# Service account tokens are Bearer style tokens that replace the traditional username/password based configuration.
# Use this token instead of a username/password.
# elasticsearch.serviceAccountToken: "my_token"

# Time in milliseconds to wait for Elasticsearch to respond to pings. Defaults to the value of
# the elasticsearch.requestTimeout setting.
#elasticsearch.pingTimeout: 1500

# Time in milliseconds to wait for responses from the back end or Elasticsearch. This value
# must be a positive integer.
#elasticsearch.requestTimeout: 30000

# The maximum number of sockets that can be used for communications with elasticsearch.
# Defaults to `Infinity`.
#elasticsearch.maxSockets: 1024

# Specifies whether Kibana should use compression for communications with elasticsearch
# Defaults to `false`.
#elasticsearch.compression: false

# List of Kibana client-side headers to send to Elasticsearch. To send *no* client-side
# headers, set this value to [] (an empty list).
#elasticsearch.requestHeadersWhitelist: [ authorization ]

# Header names and values that are sent to Elasticsearch. Any custom headers cannot be overwritten
# by client-side headers, regardless of the elasticsearch.requestHeadersWhitelist configuration.
#elasticsearch.customHeaders: {}

# Time in milliseconds for Elasticsearch to wait for responses from shards. Set to 0 to disable.
#elasticsearch.shardTimeout: 30000

# =================== System: Elasticsearch (Optional) ===================
# These files are used to verify the identity of Kibana to Elasticsearch and are required when
# xpack.security.http.ssl.client_authentication in Elasticsearch is set to required.
#elasticsearch.ssl.certificate: /path/to/your/client.crt
#elasticsearch.ssl.key: /path/to/your/client.key

# Enables you to specify a path to the PEM file for the certificate
# authority for your Elasticsearch instance.
#elasticsearch.ssl.certificateAuthorities: [ "/path/to/your/CA.pem" ]

# To disregard the validity of SSL certificates, change this setting's value to 'none'.
#elasticsearch.ssl.verificationMode: full

# =================== System: Logging ===================
# Set the value of this setting to off to suppress all logging output, or to debug to log everything. Defaults to 'info'
#logging.root.level: debug

# Enables you to specify a file where Kibana stores log output.
#logging.appenders.default:
#  type: file
#  fileName: /var/logs/kibana.log
#  layout:
#    type: json

# Logs queries sent to Elasticsearch.
#logging.loggers:
#  - name: elasticsearch.query
#    level: debug

# Logs http responses.
#logging.loggers:
#  - name: http.server.response
#    level: debug

# Logs system usage information.
#logging.loggers:
#  - name: metrics.ops
#    level: debug

# =================== System: Other ===================
# The path where Kibana stores persistent data not saved in Elasticsearch. Defaults to data
#path.data: data

# Specifies the path where Kibana creates the process ID file.
#pid.file: /run/kibana/kibana.pid

# Set the interval in milliseconds to sample system and process performance
# metrics. Minimum is 100ms. Defaults to 5000ms.
#ops.interval: 5000

# Specifies locale to be used for all localizable strings, dates and number formats.
# Supported languages are the following: English (default) "en", Chinese "zh-CN", Japanese "ja-JP", French "fr-FR".
#i18n.locale: "en"

# =================== Frequently used (Optional)===================

# =================== Saved Objects: Migrations ===================
# Saved object migrations run at startup. If you run into migration-related issues, you might need to adjust these settings.

# The number of documents migrated at a time.
# If Kibana can't start up or upgrade due to an Elasticsearch `circuit_breaking_exception`,
# use a smaller batchSize value to reduce the memory pressure. Defaults to 1000 objects per batch.
#migrations.batchSize: 1000

# The maximum payload size for indexing batches of upgraded saved objects.
# To avoid migrations failing due to a 413 Request Entity Too Large response from Elasticsearch.
# This value should be lower than or equal to your Elasticsearch cluster’s `http.max_content_length`
# configuration option. Default: 100mb
#migrations.maxBatchSizeBytes: 100mb

# The number of times to retry temporary migration failures. Increase the setting
# if migrations fail frequently with a message such as `Unable to complete the [...] step after
# 15 attempts, terminating`. Defaults to 15
#migrations.retryAttempts: 15

# =================== Search Autocomplete ===================
# Time in milliseconds to wait for autocomplete suggestions from Elasticsearch.
# This value must be a whole number greater than zero. Defaults to 1000ms
#unifiedSearch.autocomplete.valueSuggestions.timeout: 1000

# Maximum number of documents loaded by each shard to generate autocomplete suggestions.
# This value must be a whole number greater than zero. Defaults to 100_000
#unifiedSearch.autocomplete.valueSuggestions.terminateAfter: 100000


# This section was automatically generated during setup.
elasticsearch.hosts: ['http://127.0.0.1:9200'] #注意取消了https
elasticsearch.serviceAccountToken: AAEAAWVsYXN0aWMva2liYW5hL2Vucm9sbC1wcm9jZXNzLXRva2VuLTE2ODcyMzMwNzQ0NTQ6eHhvTEhtYWpSLW1PdlRNNURkd3Frdw
elasticsearch.ssl.certificateAuthorities: ['D:\aDriverDownloads\ELK\Kibana\kibana-8.8.1-windows-x86_64\kibana-8.8.1\data\ca_1687233075410.crt']
xpack.fleet.outputs: [{id: fleet-default-output, name: default, is_default: true, is_default_monitoring: true, type: elasticsearch, hosts: ['https://192.168.1.168:9200'], ca_trusted_fingerprint: 3d616e5c3d22b54a0fdd8a45aa0cb6467bd5e6dcbe4e6b7cf7e71479d703044b}]
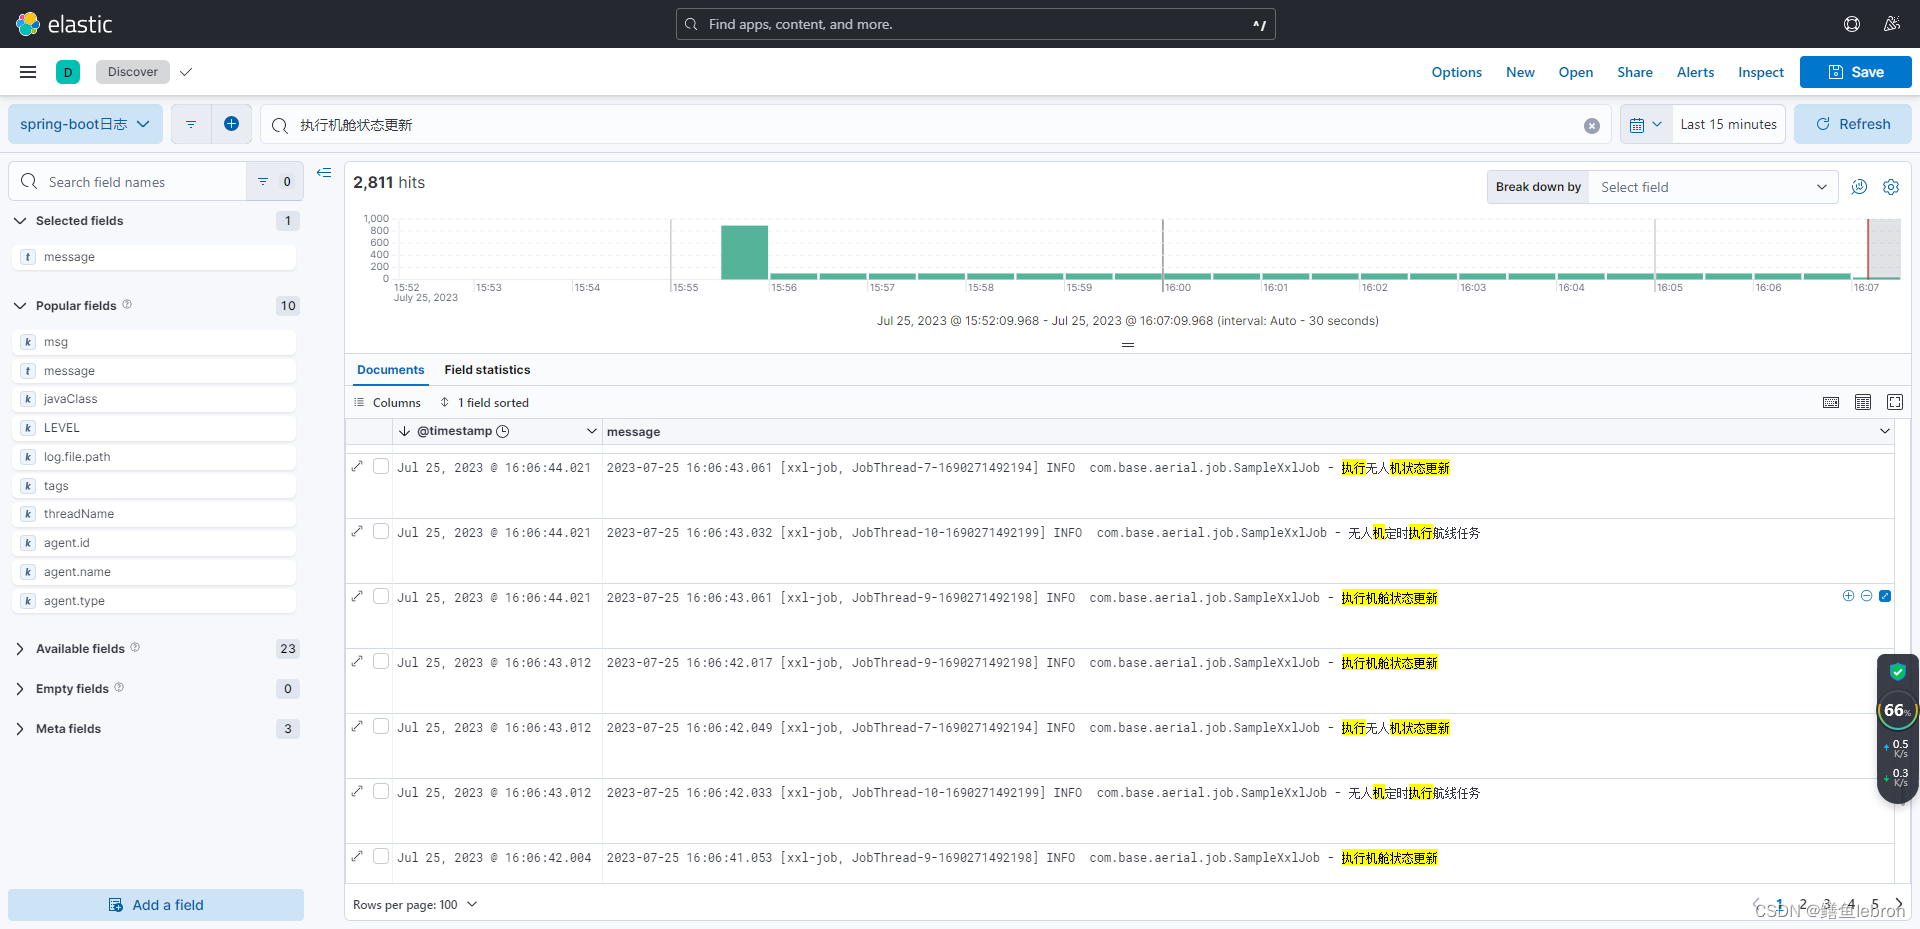
最终:kibana日志可以实时刷新


 1万+
1万+


 被折叠的 条评论
为什么被折叠?
被折叠的 条评论
为什么被折叠?
 到【灌水乐园】发言


