


名词解释
Promethus 是什么
开源的【系统监控和警报】工具包
专注于:
1)可靠的实时监控
2)收集时间序列数据
3)提供强大的查询语言(PromQL),用于分析这些数据
功能:
1)【监控】各种资源、服务和应用程序的性能指标
2)支持多维数据模型和灵活的查询语言,从而 -> 用户,可以轻松地获取他们关心的信息
Actuator 是什么
监控 SpringBoot 应用程序
在Java生态系统中,Spring Boot 提供了 Actuator 模块,用于【监控和管理】应用程序
举例
1)监控应用程序健康状况:
Actuator 提供了 /actuator/health 端点,用于检查应用程序的健康状态。通过这个端点,你可以了解应用程序是否运行正常、数据库连接是否正常等。
2)查看应用程序信息:
使用 /actuator/info 端点,可以查看应用程序的自定义信息,比如构建版本、作者、描述等。
3)监控应用程序性能:
Actuator 提供了 /actuator/metrics 端点,用于查看应用程序的各种性能指标,比如内存使用情况、线程池状态、垃圾回收等
4)查看运行时环境:
使用 /actuator/env 端点,可以查看应用程序的环境属性,包括配置属性、系统属性等。
5)查看配置信息:
通过 /actuator/configprops 和 /actuator/beans 端点,可以查看应用程序的配置信息和所有注册的 Spring beans。
Promethus 和 Actuator 的关系是什么?
一句话:Actuator 为 Promethus 提供数据
Prometheus 和 Spring Boot Actuator 是两个不同的工具,但它们可以结合使用以提供更全面的监控和管理解决方案。
Spring Boot Actuator 提供了一些默认的监控端点,包括 /actuator/prometheus 端点,该端点可以为 Prometheus 提供可以抓取的指标数据
通过配置 Prometheus,来定期从这个端点获取数据,你可以将 Spring Boot 应用程序的监控数据,整合到 Prometheus 中,从而实现集中的监控和数据分析
这种结合使用的方式使得开发人员和运维团队可以在 Prometheus 中集成 Spring Boot 应用程序的监控数据,并在 Grafana 等可视化工具中创建仪表盘,以更好地了解应用程序的性能和运行状况。
AlertManager 是什么
报警用的
AlertManager 是由Prometheus社区开发的一个组件
用于处理:Prometheus 监控系统 生成的警报。它能够管理和路由警报,发送通知以及对警报进行抑制和静音
Grafna是什么
用于【可视化和分析时序数据】的开源平台
它支持多种数据源,包括 Graphite、Prometheus、Elasticsearch、InfluxDB 等
Promethus 基本概念
Promethus 工作方式:收集、存储 metrics(指标),并将其存储为:time series data(时间序列数据)
收集 metrics(指标)的方式:【抓取(scrape)】目标的 metrics HTTP endpoints
time series: 随时间变化的记录
Metrics : 在理解应用程序,为什么,以某种方式运行、方面,发挥着重要作用
由于 Prometheus 以同样的方式,公开其自身的数据,因此,它还可以,抓取和监控,其自身的健康状况
虽然,单纯收集 Promethus 自身的数据,没什么用,但是,它却是一个很好的,快速上手的例子
prometheus.yml 配置文件如下
global:
  scrape_interval:     15s # By default, scrape targets every 15 seconds.

  # 当与外部系统通信时,将这些标签,附加到所有:【time series(时间序列)】或【alert(警报)】上
  # Attach these labels to any time series or alerts when communicating with
  # external systems (federation, remote storage, Alertmanager).
  external_labels:
    monitor: 'codelab-monitor'


# 一个抓取配置,在这里,仅包含一个要抓取的端点,就是 Prometheus 自身
# A scrape configuration containing exactly one endpoint to scrape:
# Here it's Prometheus itself.
scrape_configs:
  # The job name is added as a label `job=<job_name>` to any timeseries scraped from this config.
  - job_name: 'prometheus'


	# 覆盖全局的(第二行的那个)scrape_interval
    # Override the global default and scrape targets from this job every 5 seconds.
    scrape_interval: 5s

    static_configs:
      - targets: ['localhost:9090']
查看抓取的端点
http://localhost:9090/targets

蓝色,代表成功抓取 Prometheus 自身的数据
Prometheus 自带浏览器
让我们看一下,Promethus 抓到的,它自己的数据
访问下面地址,来使用 Prometheus 自带的浏览器地址:
http://localhost:9090/graph
另外,从 http://localhost:9090/metrics 中,可以看到:Prometheus 所暴露的,自身的指标
prometheus_target_interval_length_seconds(目标,抓取,时间间隔)

Expression browser
expression browser,位于 Prometheus 服务器上的 /graph 中,允许您输入任何表达式,并以表格形式,或随时间变化的图表形式查看其结果
这主要用于【临时查询和调试】
对于图表,请使用 Grafana 或控制台模板
如下:(和上边一致)

配置规则(将抓取的数据,聚合到新的时间序列中)
对,聚合了上千条数据的【时间序列】,进行查询,会导致缓慢
为了提高效率,Prometheus 通过配置 recording rules.,将 表达式,提前记录到,新的、持久化的,时间序列中
一个例子:
假设,我对所记录的,每个实例上的,【per-second rate of cpu time (node_cpu_seconds_total) (cpu 使用率)】感兴趣,(但要保留 job, instance, mode 维度),并对其进行测量(5 分钟的时间窗口为维度)
我们可以使用
avg by (job, instance, mode) (rate(node_cpu_seconds_total[5m]))
对应 prometheus.rules.yml 文件
groups:
- name: cpu-node
  rules:
  - record: job_instance_mode:node_cpu_seconds:avg_rate5m
    expr: avg by (job, instance, mode) (rate(node_cpu_seconds_total[5m]))
同时 prometheus.yml. 中新增
rule_files:
  - 'prometheus.rules.yml'


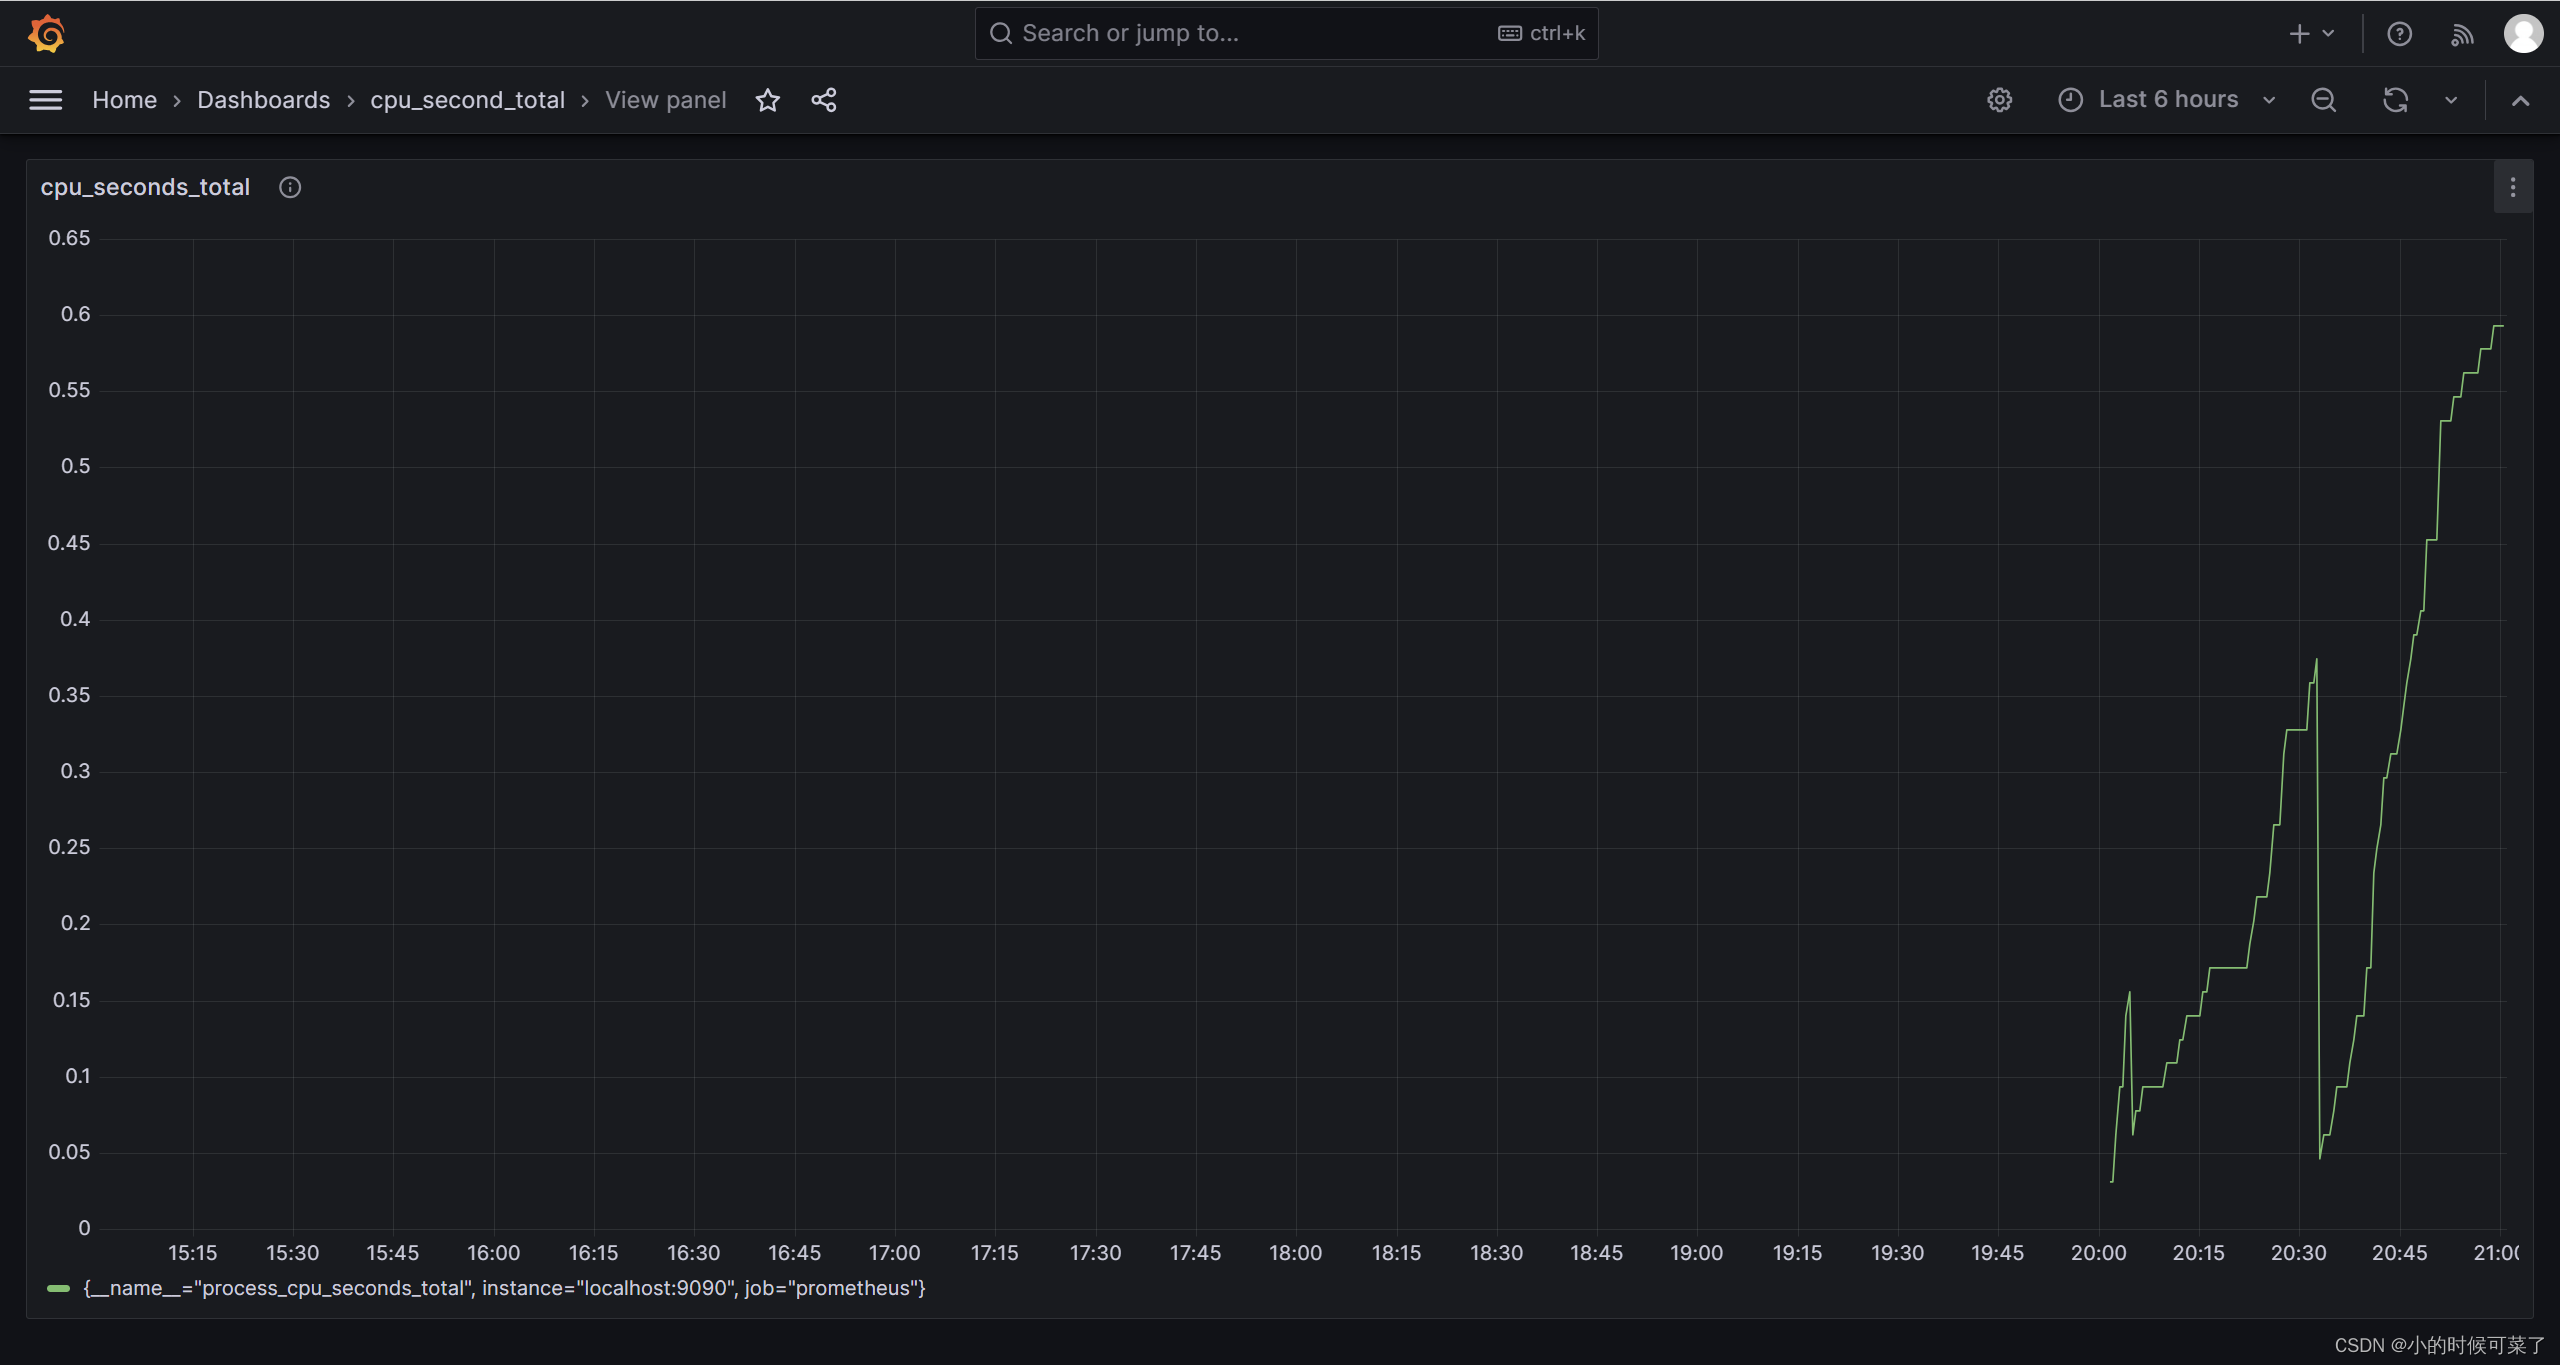
让 Grafana 支持 Prometheus


最终效果
alerting 概述
Prometheus 中的 Alerting(报警) 分为两部分
1)Prometheus servers 中的 Alerting rules 将 alerts 发送给 Alertmanager
2)之后,Alertmanager 管理这些 alerts
alerts 包括:silencing, inhibition, aggregation
以及通过 email, on-call notification systems(呼叫通知系统)和聊天平台等方式,发送通知
设置 alerting 和 notifications 的主要步骤是:
- 设置和配置 Alertmanager
- 配置 Prometheus 与 Alertmanager 对话
- 在 Prometheus 中创建警报规则
ALERTMANAGER
Alertmanager 用于处理 客户端应用(如 Prometheus Server)发出的 alerts
负责:deduplicating, grouping, and routing them to the correct receiver integration such as email, PagerDuty, or OpsGenie.
同样还负责:silencing and inhibition of alerts
下面介绍 Alertmanager 所实现的核心概念。 请参阅配置文档以了解如何更详细地使用它们。
Grouping
Grouping 将相似性质的 alerts 分类到 a single notification.
非常实用的场景:大规模停机,同时出发成百上千个警告
Inhibition
Inhibition:如果某些其他警报已经触发,则抑制某些警报的通知
举例:如果特定警报正在触发,Alertmanager 可以配置,与此集群相关的、所有其他警报静音
好处:防止无关警报出发
Silences
在给定时间内,简单地静音警报
基于 matchers 进行配置
检查 alert 是否与 等式 或 正则 匹配,是,则不会发出警报
在 Alertmanager Web 界面配置


 802
802


 被折叠的 条评论
为什么被折叠?
被折叠的 条评论
为什么被折叠?
 到【灌水乐园】发言


