vue echarts 地图
<div ref="mapChart"></div>
import echarts from 'echarts'
drawmap () {
let that = this
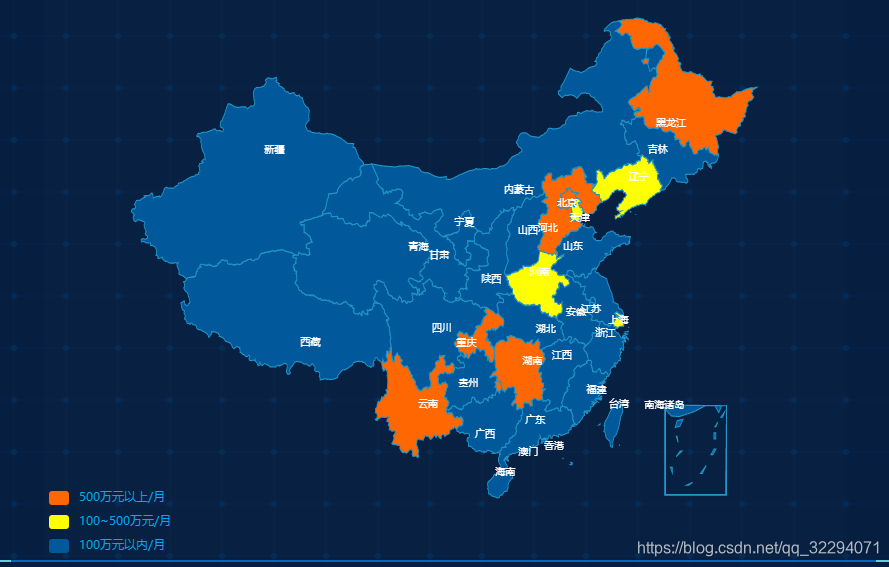
var mydata = [
{ name: '北京', value: 2343 }, { name: '天津', value: 234 },
{ name: '上海', value: 234 }, { name: '重庆', value: 2342 },
{ name: '河北', value: 543 }, { name: '河南', value: 432 },
{ name: '云南', value: 3244 }, { name: '辽宁', value: 434 },
{ name: '黑龙江', value: 600 }, { name: '湖南', value: 1000 }
]
that.mapChart = echarts.init(that.$refs.mapChart);
that.mapChart.setOption(
myChart.setOption({
backgroundColor:'rgba(128, 128, 128, 0.01)',
title: {
text: '热力图',
x: 'center'
},
tooltip: {
trigger: 'item'
},
visualMap: {
type: 'piecewise',
show: true,
x: 'left',
y: 'bottom',
pieces: [
{lt: 100,label: '100万元以内/月',color:'#01589b'},
{gte: 100,lte: 500,label: '100~500万元/月',color:'#ffff00'},
{gt: 500,label: '500万元以上/月',color:'#ff6702'},
],
textStyle:{
color:'#00abee'
}
},
series: [{
name: '随机数据',
type: 'map',
mapType: 'china',
roam: false,
label: {
normal: {
color:'#fff',
show: true,
fontSize: 10
},
emphasis: {
color:'#000',
show: false
}
},
data: mydata,
itemStyle: {
normal: {
borderWidth:1,
borderColor:'#2195c4',
areaColor: '#01589b',
},
emphasis: {
borderWidth:1,
borderColor:'#2195c4',
areaColor: '#ffffff',
}
}
}]
})
},


 193
193


 被折叠的 条评论
为什么被折叠?
被折叠的 条评论
为什么被折叠?
 到【灌水乐园】发言


