


elk日志分析系统
序
elk组件的功能这里不在过多阐述,附上官网链接 传送门
elk日志分析系统架构设计:在elk基础上增加轻量级日志文件数据搜集器filebeat和kafka,filebeat性能上相比运行于loqstash优势明显,简单易用。kafka用于提升吞吐能力。防止日志丢失,增加系统容错性。
grep '2022-07-25 1[8-9]' nohup.out  > xxx.log

sed -n '/2022-07-25 18:00:00/,/2022-07-25 18:10:00/p' nohup.out|grep -A 300  '/member/login'
单台机器可以使用,tail、sed、grep、awk等命令查看日志,集群环境下如果仍然使用依次登录每台机器的传统方法查看日志。过程繁琐且效率低下。
分布式部署的架构,需要根据问题信息,快速定位到具体的服务器和服务模块,因此构建一套集中式日志分析系统,可以提高定位问题的效率。
前言
elk日志分析系统从零搭建,以及搭建过程中遇到问题的解决,最后到系统日志分析实战
一、elasticsearch
下载地址:elasticsearch-8.3.2-linux-x86_64
1.创建elasticsearch用户
groupadd elasticsearch
useradd elasticsearch -g elasticsearch -p elasticsearch
启动es时需要用到该用户启动
2.下载解压安装
tar -zxvf elasticsearch-8.3.2-linux-x86_64.tar.gz -C /usr/local
2.修改配置文件elasticsearch.yml
cd /usr/local/elasticsearch-8.3.2/config/

vim elasticsearch.yml
# Use a descriptive name for your cluster:
cluster.name: my-application
# Use a descriptive name for the node:
node.name: node-1
# Path to directory where to store the data (separate multiple locations by comma):
path.data: /data/es
# Path to log files:
path.logs: /data/es/logs
# By default Elasticsearch is only accessible on localhost. Set a different
# address here to expose this node on the network:
network.host: 0.0.0.0
# By default Elasticsearch listens for HTTP traffic on the first free port it
# finds starting at 9200. Set a specific HTTP port here:
http.port: 9200
# Pass an initial list of hosts to perform discovery when this node is started:
# The default list of hosts is ["127.0.0.1", "[::1]"]
discovery.seed_hosts: ["127.0.0.1"]
# Bootstrap the cluster using an initial set of master-eligible nodes:
cluster.initial_master_nodes: ["node-1"]
3.创建path.data和path.logs文件夹,授权给elasticsearch用户
mkdir /data/es/logs

chown -R elasticsearch:elasticsearch /data/es
chown -R elasticsearch:elasticsearch /usr/local/elasticsearch-8.3.2
4.修改limits.conf和sysctl.conf
首次启动可能会报以下异常
bootstrap check failure [1] of [3]: max virtual memory areas vm.max_map_count [65530] is too low, increase to at least [262144]
bootstrap check failure [2] of [3]: the default discovery settings are unsuitable for production use; at least one of [discovery.seed_hosts, discovery.seed_providers, cluster.initial_master_nodes] must be configured
bootstrap check failure [3] of [3]: Transport SSL must be enabled if security is enabled. Please set [xpack.security.transport.ssl.enabled] to [true] or disable security by setting [xpack.security.enabled] to [false]
vim /etc/security/limits.conf
*  soft  nofile  262144
*  hard  nofile  262144
vim /etc/sysctl.conf
vm.max_map_count=262144
适当调小es的内存占用
vim /usr/local/elasticsearch-8.3.2/config/jvm.options
-Xms2g
-Xmx2g
5.开启xpack验证
cd /usr/local/elasticsearch-8.3.2
生成CA证书,将产生新文件 elastic-stack-ca.p12,提示输入密码时,直接回车即可
./bin/elasticsearch-certutil ca
为集群中的每个节点生成证书和私钥,将产生新文件 elastic-certificates.p12提示输入密码时,直接回车即可
./bin/elasticsearch-certutil cert --ca elastic-stack-ca.p12
将生成的elastic-stack-ca.p12,elastic-certificates.p12文件复制到config下面
cp elastic-stack-ca.p12 elastic-certificates.p12 ./config
修改elasticsearch.yml配置
vim elasticsearch.yml
xpack.security.enabled: true
xpack.security.transport.ssl.enabled: true
xpack.security.transport.ssl.verification_mode: certificate
xpack.security.transport.ssl.keystore.path: elastic-certificates.p12
xpack.security.transport.ssl.truststore.path: elastic-certificates.p12


http.cors.enabled: true
http.cors.allow-origin: "*"
修改kibana用户的密码,后面使用
./bin/elasticsearch-reset-password -u kibana
重启Elasticsearch
注意:开放防火墙端口9200,若使用云服务器同时配置安全组
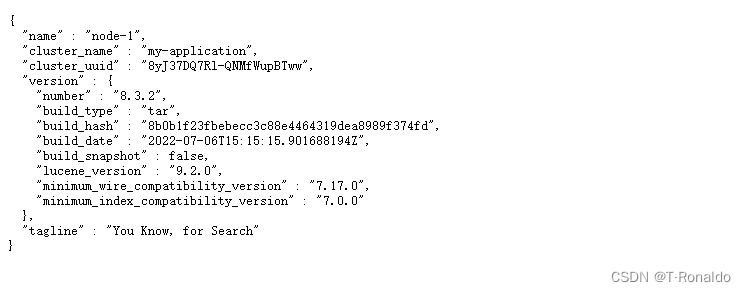
浏览器输入:http://ip:9200,出现以下信息代表OK
二、logstash
下载地址:logstash-8.3.2-linux-x86_64
解压安装
tar -zxvf logstash-8.3.2-linux-x86_64.tar.gz -C /usr/local
1.修改logstash-sample.conf配置
# Sample Logstash configuration for creating a simple
# Beats -> Logstash -> Elasticsearch pipeline.

input {
  beats {
    port => 5044
  }
}

output {
  elasticsearch {
    hosts => ["http://xxx.xxx.xxx.xxx:9200"]
    index => "%{[@metadata][beat]}-%{[@metadata][version]}-%{+YYYY.MM.dd}"
    user => "elastic"
    password => "changeme"
  }
}
2.启动logstash
/usr/local/logstash-8.3.2/bin/logstash -f ./config/logstash-sample.conf &
三、kibana
下载地址:kibana-8.3.2-linux-x86_64
解压安装
tar -zxvf kibana-8.3.2-linux-x86_64.tar.gz -C /usr/local
1.修改配置文件kibana.yml
cd /usr/local/kibana-8.3.2/config
vim kibana.yml
# Kibana is served by a back end server. This setting specifies the port to use.
server.port: 5601
# Specifies the address to which the Kibana server will bind. IP addresses and host names are both valid values.
# The default is 'localhost', which usually means remote machines will not be able to connect.
# To allow connections from remote users, set this parameter to a non-loopback address.
server.host: "0.0.0.0"
# =================== System: Elasticsearch ===================
# The URLs of the Elasticsearch instances to use for all your queries.
elasticsearch.hosts: ["http://xxx.xxx.xxx.xxx:9200"]
# If your Elasticsearch is protected with basic authentication, these settings provide
# the username and password that the Kibana server uses to perform maintenance on the Kibana
# index at startup. Your Kibana users still need to authenticate with Elasticsearch, which
# is proxied through the Kibana server.
elasticsearch.username: "kibana"
elasticsearch.password: "changeme"
2.启动kibana
/usr/local/kibana-8.3.2/bin/kibana --allow-root &
开放防火墙5601端口,云服务添加安全组配置
浏览器访问 http://ip:5601
使用elastic用户进行登录
四、filebeat
下载地址:filebeat-8.3.2-linux-x86_64
解压安装
tar -zxvf filebeat-8.3.2-linux-x86_64.tar.gz -C /usr/local
cd /usr/local/filebeat-8.3.2-linux-x86_64
1.修改配置文件filebeat.yml
vim filebeat.yml
 21 # filestream is an input for collecting log messages from files.
 22 - type: filestream
 23
 24   # Unique ID among all inputs, an ID is required.
 25   id: my-filestream-id
 26
 27   # Change to true to enable this input configuration.
 28   enabled: true
 29
 30   # Paths that should be crawled and fetched. Glob based paths.
 31   paths:
 32     - /var/log/*.log
 100 # =================================== Kibana ===================================
101
102 # Starting with Beats version 6.0.0, the dashboards are loaded via the Kibana API.
103 # This requires a Kibana endpoint configuration.
104 setup.kibana:
105
106   # Kibana Host
107   # Scheme and port can be left out and will be set to the default (http and 5601)
108   # In case you specify and additional path, the scheme is required: http://localhost:5601/path
109   # IPv6 addresses should always be defined as: https://[2001:db8::1]:5601
110   host: "xxx.xxx.xxx.xxx:5601"
130 # ================================== Outputs ===================================
131
132 # Configure what output to use when sending the data collected by the beat.
133
134 # ---------------------------- Elasticsearch Output ----------------------------
135 output.elasticsearch:
136   # Array of hosts to connect to.
137   hosts: ["xxx.xxx.xxx.xxx:9200"]
138
139   # Protocol - either `http` (default) or `https`.
140   #protocol: "https"
141
142   # Authentication credentials - either API key or username/password.
143   #api_key: "id:api_key"
144   username: "elastic"
145   password: "changeme"
2.启动filebeat
/usr/local/filebeat-8.3.2-linux-x86_64/filebeat &
五、kafka
下载地址:kafka_2.13-3.2.0
解压安装
tar -zxvf kafka_2.13-3.2.0.tgz -C /usr/local
1.修改kafka配置
cd /usr/local/kafka_2.13-3.2.0/config
修改zookeeper.properties
vim zookeeper.properties
# the directory where the snapshot is stored.
dataDir=/data/zookeeper
# the port at which the clients will connect
clientPort=2181
# disable the per-ip limit on the number of connections since this is a non-production config
maxClientCnxns=0
# Disable the adminserver by default to avoid port conflicts.
# Set the port to something non-conflicting if choosing to enable this
admin.enableServer=false
# admin.serverPort=8080
mkdir /data/zookeeper
mkdir /data/kafka-logs
修改server.properties
vim server.properties
# The id of the broker. This must be set to a unique integer for each broker.
broker.id=0

############################# Socket Server Settings #############################

# The address the socket server listens on. If not configured, the host name will be equal to the value of
# java.net.InetAddress.getCanonicalHostName(), with PLAINTEXT listener name, and port 9092.
#   FORMAT:
#     listeners = listener_name://host_name:port
#   EXAMPLE:
#     listeners = PLAINTEXT://your.host.name:9092
listeners=PLAINTEXT://xxx.xxx.xxx.xxx:9092
############################# Log Basics #############################

# A comma separated list of directories under which to store log files
log.dirs=/data/kafka-logs

# The default number of log partitions per topic. More partitions allow greater
# parallelism for consumption, but this will also result in more files across
# the brokers.
num.partitions=1

# The number of threads per data directory to be used for log recovery at startup and flushing at shutdown.
# This value is recommended to be increased for installations with data dirs located in RAID array.
num.recovery.threads.per.data.dir=1
############################# Zookeeper #############################

# Zookeeper connection string (see zookeeper docs for details).
# This is a comma separated host:port pairs, each corresponding to a zk
# server. e.g. "127.0.0.1:3000,127.0.0.1:3001,127.0.0.1:3002".
# You can also append an optional chroot string to the urls to specify the
# root directory for all kafka znodes.
zookeeper.connect=xxx.xxx.xxx.xxx:2181

# Timeout in ms for connecting to zookeeper
zookeeper.connection.timeout.ms=18000
先启动zookeeper服务
./bin/zookeeper-server-start.sh -daemon ./config/zookeeper.properties
启动kafka服务
./bin/kafka-server-start.sh -daemon ./config/server.properties
创建一个名为test的topic
./bin/kafka-topics.sh --bootstrap-server yourhostname:9092 --create --topic test --partitions 1 --replication-factor 1
查看topic列表
./bin/kafka-topics.sh --bootstrap-server yourhostname:9092 --list
六、日志分析
浏览器输入 http://ip:5601 进入到kibana
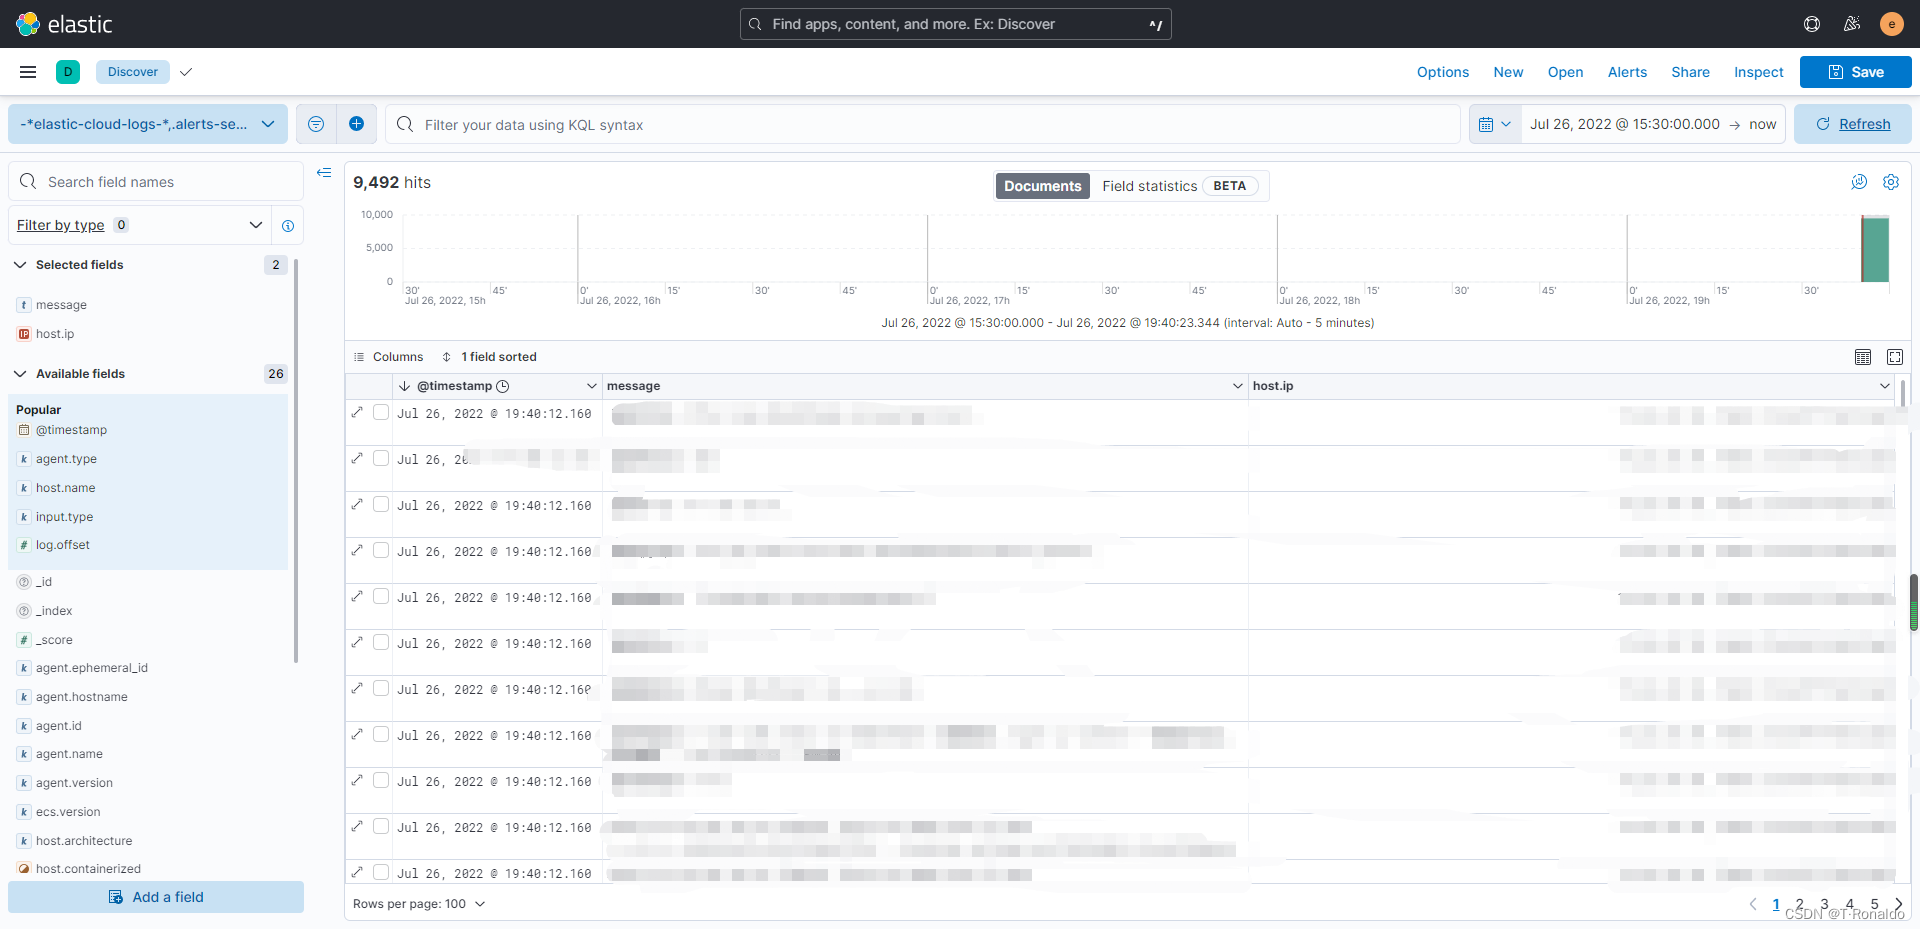
点击home下面的Analytics下面的Discover,如上图展示
通过host.ip,可以选择不同的服务器进行日志查看
总结
诗词赏析
将进酒
李白 〔唐代〕

君不见黄河之水天上来,奔流到海不复回。
君不见高堂明镜悲白发,朝如青丝暮成雪。
人生得意须尽欢,莫使金樽空对月。
天生我材必有用,千金散尽还复来。
烹羊宰牛且为乐,会须一饮三百杯。
岑夫子,丹丘生,将进酒,杯莫停。
与君歌一曲,请君为我倾耳听。(倾耳听 一作:侧耳听)
钟鼓馔玉不足贵,但愿长醉不愿醒。(不足贵 一作:何足贵;不愿醒 一作:不复醒)
古来圣贤皆寂寞,惟有饮者留其名。(古来 一作:自古;惟 通:唯)
陈王昔时宴平乐,斗酒十千恣欢谑。
主人何为言少钱,径须沽取对君酌。
五花马、千金裘,呼儿将出换美酒,与尔同销万古愁。


 471
471


 被折叠的 条评论
为什么被折叠?
被折叠的 条评论
为什么被折叠?
 到【灌水乐园】发言


