


创建逻辑回归分类器(Logistic_regression)
逻辑回归是一种分类方法,给定一组数据点,需要建立一个可以再类之间绘制线性回归的模型
代码实现如下:
#-*- coding:utf-8 -*-
import numpy as np
from sklearn import linear_model
import matplotlib.pyplot as plt
#建立样本数据
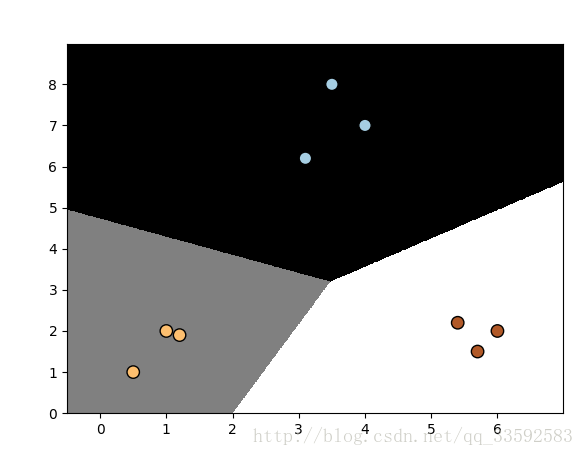
x=np.array([[4,7],[3.5,8],[3.1,6.2],[0.5,1],[1,2],[1.2,1.9],[6,2],[5.7,1.5],[5.4,2.2]])
y=np.array([0,0,0,1,1,1,2,2,2])
#初始化一个逻辑回归分类器 其中solver表示设置求解系统方程的算法类型,C代表正则化程度,数值越小,正则化强度越高
classifier=linear_model.LogisticRegression(solver='liblinear',C=10000)
#训练分类器 拟合
classifier.fit(x,y)
#画出数据点和边界
def plot_classifier(classifier,x,y):
x_min,x_max=min(x[:,0])-1.0,max(x[:,0])+1.0
y_min,y_max=min(x[:,1])-1.0,max(x[:,1])+1.0
# 设置网格数据的步长
step_size = 0.01
# 定义网格
x_values, y_values = np.meshgrid(np.arange(x_min, x_max, step_size), np.arange(y_min, y_max, step_size))
# 计算分类器输出结果
mesh_output = classifier.predict(np.c_[x_values.ravel(), y_values.ravel()])
# 数组维度变形
mesh_output = mesh_output.reshape(x_values.shape)
# 用彩色区域画出各个类型的边界
plt.figure()
plt.pcolormesh(x_values, y_values, mesh_output, cmap=plt.cm.gray)
# 将训练数据点画在图形上
plt.scatter(x[:, 0], x[:, 1], c=y, s=80, edgecolors='black', linewidth=1, cmap=plt.cm.Paired)
# 设置图形的取值范围
plt.xlim(x_values.min(), x_values.max())
plt.ylim(y_values.min(), y_values.max())
#设置x轴与y轴 使得刻度为单位刻度 且为整数
plt.xticks((np.arange(int(min(x[:,0])-1),int(max(x[:,0])+1),1.0)))
plt.yticks((np.arange(int(min(x[:,1])-1),int(max(x[:,1])+1),1.0)))
plt.show()
plot_classifier(classifier,x,y)
输出图形如下:


 5995
5995

 被折叠的 条评论
为什么被折叠?
被折叠的 条评论
为什么被折叠?
 到【灌水乐园】发言


