


引言
什么是压测
压测,即压力测试,是指对计算机系统、软件应用或网络服务等进行负载测试,以模拟实际使用场景中的高负载情况,检验系统在压力下的性能、稳定性和可靠性。压测旨在确定系统在正常或极端负载下的性能极限,以便在生产环境中提供最佳的性能和可靠性。
为什么要压测
- 了解ES各版本性能差异:ES版本更新很快,每次版本更新都会带来性能提升,但只有当我们进过性能测试后,才能清楚的知道性能提升幅度,再决定是否需要升级。
- 针对ES参数做验证测试:我们都知道调整索引分片、副本数、刷新时间等参数可以提高读写性能,但具体需要设置为多少,可以通过压测有更直观的对比。
- 了解集群性能瓶颈:只有针对ES集群做压测,才能清楚的知道集群读写性能峰值多少,性能瓶颈在磁盘还是网络带宽,通过找出并解决性能瓶颈,可以提高集群的性能和可靠性,提升用户体验。
- 集群容量规划: 压测可以帮助我们规划系统的容量和资源需求,包括服务器配置、网络带宽、存储容量等。通过了解系统在不同负载下的资源消耗情况,可以合理规划资源投入,避免资源不足或浪费。
如何进行压测
- 使用官方工具esrally:elastic官方提供了压测工具,内置多种数据集可模拟各个应用场景下的需求。模拟真实的生产环境中的负载,包括索引、搜索、聚合等操作,以便评估 Elasticsearch 在不同负载下的性能表现。支持测试不同版本的 Elasticsearch,用户可以轻松地比较不同版本之间的性能差异。生成详细的测试报告,包括测试结果、性能指标、图表等,帮助用户全面了解测试的结果。
- 使用http压测工具:可以通过http协议的压测工具比如JMeter、httpload等,通过请求es的 Restful API接口进行性能测试。
- 开发程序使用客户端请求测试:es支持多个语言的sdk包,可以针对特定使用场景开发程序进行性能测试。
esrally简介
esrally优点
- 模拟真实场景: Rally 可以模拟真实的生产环境中的负载,包括索引、搜索、聚合等操作,以便评估 Elasticsearch 在不同负载下的性能表现。
- 多种负载类型: Rally 提供了多种预置的负载类型,如Index、Search、Bulk、Update等,用户可以根据需求选择合适的负载类型进行测试。
- 灵活的配置: Rally 允许用户对测试进行灵活的配置,包括索引设置、数据量、并发度等参数。用户可以根据自己的需求定制测试方案。
- 自动化测试: Rally 支持自动化测试流程,可以通过简单的命令行操作启动测试,并自动收集性能数据、生成报告等。
- 多版本支持: Rally 支持测试不同版本的 Elasticsearch,用户可以轻松地比较不同版本之间的性能差异。
- 丰富的报告: Rally 生成详细的测试报告,包括测试结果、性能指标、图表等,帮助用户全面了解测试的结果。
- 可扩展性: Rally 具有良好的可扩展性,用户可以编写自定义的测试插件,以满足特定的测试需求。
- 社区支持: Rally 是一个开源项目,拥有活跃的社区支持,用户可以在 GitHub 上提交问题、提出建议,并参与到项目的开发和改进中来。
参考文档
仓库地址:https://github.com/elastic/rally
官方文档:https://esrally.readthedocs.io/en/latest/quickstart.html
安装esrally
安装条件
Python3.8+
git 1.9+
jdk 1.8+
安装过程
# 安装软件包
[root@es-repo ~]# dnf -y install python3.11 python3.11-devel python3.11-pip git java-17-openjdk pbzip2

# 验证版本
[root@es-repo ~]# java -version
openjdk version "17.0.10" 2024-01-16 LTS
OpenJDK Runtime Environment (Red_Hat-17.0.10.0.7-1) (build 17.0.10+7-LTS)
OpenJDK 64-Bit Server VM (Red_Hat-17.0.10.0.7-1) (build 17.0.10+7-LTS, mixed mode, sharing)
[root@es-repo ~]# python3.11 -V
Python 3.11.5

# 添加java home环境变量
[root@es-repo ~]# cat >> /etc/profile <<EOF
export JAVA_HOME=/usr/lib/jvm/java-17-openjdk-17.0.10.0.7-2.el9.x86_64
export JRE_HOME=$JAVA_HOME/jre
PATH=$JAVA_HOME/bin:$JRE_HOME/bin:$PATH
EOF
[root@es-repo ~]# source /etc/profile
[root@es-repo ~]# echo $JAVA_HOME
/usr/lib/jvm/java-11-openjdk-11.0.22.0.7-2.el9.x86_64

# 安装esrally
[root@es-repo ~]# pip3.11 install esrally -i https://pypi.tuna.tsinghua.edu.cn/simple
[root@es-repo ~]# esrally --version
esrally 2.10.0


# 查看esrally测试数据集
[root@es-repo ~]# esrally list tracks

    ____        ____
   / __ \____ _/ / /_  __
  / /_/ / __ `/ / / / / /
 / _, _/ /_/ / / / /_/ /
/_/ |_|\__,_/_/_/\__, /
                /____/

Available tracks:

Name                     Description                                                                       Documents    Compressed Size    Uncompressed Size    Default Challenge                               All Challenges
-----------------------  --------------------------------------------------------------------------------  -----------  -----------------  -------------------  ----------------------------------------------  ----------------------------------------------------------------------------------------------------------------------------------------------------------------------------------------------------------------------------------------------------------------------------------------------------------
cohere_vector            Benchmark for vector search with Cohere Wikipedia data                            32,893,221   186.9 GB           507.0 GB             index-and-search                                index-and-search
dense_vector             Benchmark for dense vector indexing and search                                    10,000,000   7.2 GB             19.5 GB              index-and-search                                index-and-search
elastic/apm              Elastic APM benchmark for Rally                                                   19,557       N/A                52.4 MB              default                                         default
elastic/endpoint         Endpoint track                                                                    0            0 bytes            0 bytes              default                                         default
elastic/logs             Track for simulating logging workloads                                            16,469,078   N/A                N/A                  logging-indexing                                cross-clusters-search-and-replication,cross-clusters-search-and-snapshot,logging-disk-usage,logging-indexing-querying,logging-indexing,logging-querying-concurrent-stress,logging-querying,logging-snapshot-mount,logging-snapshot-restore,logging-snapshot,many-shards-quantitative,many-shards-snapshots
elastic/security         Track for simulating Elastic Security workloads                                   77,513,777   N/A                N/A                  security-querying                               generate-alerts-source-events,security-indexing-querying,security-indexing,security-querying
elser-ingest-speedtest   Benchmark weighted terms queries on ELSER tokens on the MS MARCO passage dataset  1,050,000    N/A                2.0 GB               ELSER-V2                                        ELSER-V1,ELSER-V2-PlatformSpecific,ELSER-V2,ELSER-Min-Latency-Multi-Doc-Multi-Parametric-Ingest,ELSER-Size-Search-Multi-Doc-Multi-Parametric-Ingest,ELSER-Multi-Doc-Multi-Parametric-Ingest,ELSER-Multi-Parametric-Ingest
eql                      EQL benchmarks based on endgame index of SIEM demo cluster                        60,782,211   4.5 GB             109.2 GB             default                                         default,index-sorting
geonames                 POIs from Geonames                                                                11,396,503   252.9 MB           3.3 GB               append-no-conflicts                             append-no-conflicts,append-no-conflicts-index-only,append-fast-with-conflicts,significant-text
geopoint                 Point coordinates from PlanetOSM                                                  60,844,404   482.1 MB           2.3 GB               append-no-conflicts                             append-no-conflicts,append-no-conflicts-index-only,append-fast-with-conflicts
geopointshape            Point coordinates from PlanetOSM indexed as geoshapes                             60,844,404   470.8 MB           2.6 GB               append-no-conflicts                             append-no-conflicts,append-no-conflicts-index-only,append-fast-with-conflicts
geoshape                 Shapes from PlanetOSM                                                             84,220,567   17.0 GB            58.7 GB              append-no-conflicts                             append-no-conflicts,append-no-conflicts-big
http_logs                HTTP server log data                                                              247,249,096  1.2 GB             31.1 GB              append-no-conflicts                             append-no-conflicts,runtime-fields,append-no-conflicts-index-only,append-sorted-no-conflicts,append-index-only-with-ingest-pipeline,update,append-no-conflicts-index-reindex-only
k8s_metrics              Index refresh benchmarks with a Kubernetes pod metrics dataset                    8,642,016    2.1 GB             86.1 GB              append-no-conflicts-metrics-index-with-refresh  append-no-conflicts-metrics-index-with-refresh,append-no-conflicts-metrics-index-with-intermittent-refresh,append-no-conflicts-metrics-index-only,append-no-conflicts-metrics-with-fast-refresh,fast-refresh-index-only,fast-refresh-index-with-search
metricbeat               Metricbeat data                                                                   1,079,600    87.7 MB            1.2 GB               append-no-conflicts                             append-no-conflicts
msmarco-passage-ranking  Benchmark bm25, semantic and hybrid search on the MS MARCO passage dataset        8,841,823    16.3 GB            53.6 GB              msmarco-passage-ranking                         msmarco-passage-ranking
nested                   StackOverflow Q&A stored as nested docs                                           11,203,029   663.3 MB           3.4 GB               nested-search-challenge                         nested-search-challenge,index-only
noaa                     Global daily weather measurements from NOAA                                       33,659,481   949.4 MB           9.0 GB               append-no-conflicts                             append-no-conflicts,append-no-conflicts-index-only,aggs,filter-aggs
nyc_taxis                Taxi rides in New York in 2015                                                    165,346,708  4.5 GB             74.3 GB              append-no-conflicts                             append-no-conflicts,append-no-conflicts-index-only,append-sorted-no-conflicts-index-only,update,update-only,append-ml,aggs,esql,update-aggs-only,autoscale,autoscale-v2
openai_vector            Benchmark for vector search using the OpenAI text-embedding-ada-002 model         2,680,961    31.0 GB            87.3 GB              index-and-search                                index-and-search
percolator               Percolator benchmark based on AOL queries                                         2,000,000    121.1 kB           104.9 MB             append-no-conflicts                             append-no-conflicts
pmc                      Full text benchmark with academic papers from PMC                                 574,199      5.5 GB             21.7 GB              append-no-conflicts                             append-no-conflicts,append-no-conflicts-index-only,append-sorted-no-conflicts,append-fast-with-conflicts,indexing-querying
random_vector            Benchmarking filtered search on random vectors                                    0            0 bytes            0 bytes              index-and-search                                index-and-search
so                       Indexing benchmark using up to questions and answers from StackOverflow           36,062,278   8.9 GB             33.1 GB              append-no-conflicts                             append-no-conflicts,transform,frequent-items
so_vector                Benchmark for vector search with StackOverflow data                               2,000,000    12.3 GB            32.2 GB              index-and-search                                index-and-search
sql                      SQL query performance based on NOAA Weather data                                  33,659,481   949.4 MB           9.0 GB               sql                                             sql
tsdb                     metricbeat information for elastic-app k8s cluster                                116,633,698  N/A                123.0 GB             append-no-conflicts                             append-no-conflicts,downsample
tsdb_k8s_queries         metricbeat information for elastic-app k8s cluster                                17,280,000   N/A                60.3 GB              append-no-conflicts                             append-no-conflicts-rampup,append-no-conflicts,append-no-conflicts-index-only,esql
wikipedia                Benchmark for search with Wikipedia data                                          22,986,185   17.9 GB            76.7 GB              index-and-search                                index-and-search

--------------------------------
[INFO] SUCCESS (took 60 seconds)
--------------------------------
可以看到esrally为我们内置了多种使用场景下的测试数据集,我们只需要按实际使用场景选择其中一种数据集进行测试即可。
使用esrally
在线快速测试
esrally可以在没有ES实列的情况下,去基于某一个指定版本的ES进行性能测试。
它的工作流程是:esrally会先去elastic官网下载对应的版本存在esrally目录里。下载完ES版本后,再去下载针对ES产品的性能测试数据。数据下载到本地后,再进行性能分析,最后将结果打印到控制台。
我们以目前最新的8.12.2版本为例,指定数据集为geopoint,测试类型为高速追加与并发索引操作场景下性能测试。
[root@es-repo ~]# useradd esrally
[root@es-repo ~]# su - esrally
[esrally@es-repo ~]$ esrally race --distribution-version=8.12.2 --track=geopoint --challenge=append-fast-with-conflicts

    ____        ____
   / __ \____ _/ / /_  __
  / /_/ / __ `/ / / / / /
 / _, _/ /_/ / / / /_/ /
/_/ |_|\__,_/_/_/\__, /
                /____/

[INFO] Race id is [069938ff-b7c5-476a-966c-e5f96c2be780]
[INFO] Preparing for race ...
[INFO] Downloading Elasticsearch 8.12.2 (592.4 MB total size)                     [100.0%]
[INFO] Downloading track data (482.1 MB total size)                               [100.0%]
[INFO] Decompressing track data from [/home/esrally/.rally/benchmarks/data/geopoint/documents.json.bz2] to [/home/esrally/.rally/benchmarks/data/geopoint/documents.json] (resulting size: [2.28] GB) ... [OK]
[INFO] Preparing file offset table for [/home/esrally/.rally/benchmarks/data/geopoint/documents.json] ... [OK]
[INFO] Racing on track [geopoint], challenge [append-fast-with-conflicts] and car ['defaults'] with version [8.12.2].
Running delete-index                                                           [100% done]
Running create-index                                                           [100% done]
Running check-cluster-health                                                   [100% done]
Running index-update                                                           [100% done]
Running refresh-after-index                                                    [100% done]
Running force-merge                                                            [100% done]
Running refresh-after-force-merge                                              [100% done]
Running wait-until-merges-finish                                               [100% done]

------------------------------------------------------
    _______             __   _____
   / ____(_)___  ____ _/ /  / ___/_________  ________
  / /_  / / __ \/ __ `/ /   \__ \/ ___/ __ \/ ___/ _ \
 / __/ / / / / / /_/ / /   ___/ / /__/ /_/ / /  /  __/
/_/   /_/_/ /_/\__,_/_/   /____/\___/\____/_/   \___/
------------------------------------------------------

|                                                         Metric |         Task |           Value |   Unit |
|---------------------------------------------------------------:|-------------:|----------------:|-------:|
|                     Cumulative indexing time of primary shards |              |    51.1839      |    min |
|             Min cumulative indexing time across primary shards |              |     8.50077     |    min |
|          Median cumulative indexing time across primary shards |              |     8.53849     |    min |
|             Max cumulative indexing time across primary shards |              |     8.5551      |    min |
|            Cumulative indexing throttle time of primary shards |              |     0           |    min |
|    Min cumulative indexing throttle time across primary shards |              |     0           |    min |
| Median cumulative indexing throttle time across primary shards |              |     0           |    min |
|    Max cumulative indexing throttle time across primary shards |              |     0           |    min |
|                        Cumulative merge time of primary shards |              |    17.3986      |    min |
|                       Cumulative merge count of primary shards |              |   119           |        |
|                Min cumulative merge time across primary shards |              |     2.46218     |    min |
|             Median cumulative merge time across primary shards |              |     2.69797     |    min |
|                Max cumulative merge time across primary shards |              |     4.05352     |    min |
|               Cumulative merge throttle time of primary shards |              |     0.429533    |    min |
|       Min cumulative merge throttle time across primary shards |              |     0.0546667   |    min |
|    Median cumulative merge throttle time across primary shards |              |     0.0624083   |    min |
|       Max cumulative merge throttle time across primary shards |              |     0.121967    |    min |
|                      Cumulative refresh time of primary shards |              |     9.8296      |    min |
|                     Cumulative refresh count of primary shards |              |   560           |        |
|              Min cumulative refresh time across primary shards |              |     1.51657     |    min |
|           Median cumulative refresh time across primary shards |              |     1.64044     |    min |
|              Max cumulative refresh time across primary shards |              |     1.74402     |    min |
|                        Cumulative flush time of primary shards |              |     0.688033    |    min |
|                       Cumulative flush count of primary shards |              |    24           |        |
|                Min cumulative flush time across primary shards |              |     0.0333333   |    min |
|             Median cumulative flush time across primary shards |              |     0.129933    |    min |
|                Max cumulative flush time across primary shards |              |     0.193933    |    min |
|                                        Total Young Gen GC time |              |    94.11        |      s |
|                                       Total Young Gen GC count |              |  2071           |        |
|                                          Total Old Gen GC time |              |     0           |      s |
|                                         Total Old Gen GC count |              |     0           |        |
|                                                     Store size |              |     2.59487     |     GB |
|                                                  Translog size |              |     3.07336e-07 |     GB |
|                                         Heap used for segments |              |     0           |     MB |
|                                       Heap used for doc values |              |     0           |     MB |
|                                            Heap used for terms |              |     0           |     MB |
|                                            Heap used for norms |              |     0           |     MB |
|                                           Heap used for points |              |     0           |     MB |
|                                    Heap used for stored fields |              |     0           |     MB |
|                                                  Segment count |              |   100           |        |
|                                    Total Ingest Pipeline count |              |     0           |        |
|                                     Total Ingest Pipeline time |              |     0           |      s |
|                                   Total Ingest Pipeline failed |              |     0           |        |
|                                                 Min Throughput | index-update | 22891.2         | docs/s |
|                                                Mean Throughput | index-update | 46390.4         | docs/s |
|                                              Median Throughput | index-update | 48999.4         | docs/s |
|                                                 Max Throughput | index-update | 50301           | docs/s |
|                                        50th percentile latency | index-update |   654.643       |     ms |
|                                        90th percentile latency | index-update |   985.375       |     ms |
|                                        99th percentile latency | index-update |  2593.74        |     ms |
|                                      99.9th percentile latency | index-update |  4959.35        |     ms |
|                                     99.99th percentile latency | index-update |  6490.22        |     ms |
|                                       100th percentile latency | index-update |  6621.38        |     ms |
|                                   50th percentile service time | index-update |   654.643       |     ms |
|                                   90th percentile service time | index-update |   985.375       |     ms |
|                                   99th percentile service time | index-update |  2593.74        |     ms |
|                                 99.9th percentile service time | index-update |  4959.35        |     ms |
|                                99.99th percentile service time | index-update |  6490.22        |     ms |
|                                  100th percentile service time | index-update |  6621.38        |     ms |
|                                                     error rate | index-update |     0           |      % |


----------------------------------
[INFO] SUCCESS (took 1400 seconds)
----------------------------------
测试结果中我们需要着重关注的参数如下:
| Median cumulative indexing time across primary shards | 主分片中索引文档所花费的最小、最大和中位数时间。 |
|---|---|
| Cumulative merge time of primary shards | 主分片合并时间总和:主分片在测试期间进行合并操作所花费的总时间。 |
| Median Throughput | 中位数吞吐量:在测试期间,每秒处理的中位数请求量。 |
| Max Throughput | 最大值吞吐量:在测试期间,每秒处理的最大值请求量。 |
| 99th percentile latency | 99th百分位数延迟:在所有的请求中,有99%的请求的响应时间都小于或等于该值,只有1%的请求的响应时间超过该值 |
| 99th percentile service time | 99th百分位数服务时间:有99%的请求的服务时间(即服务器实际处理请求的时间)都小于或等于该值,只有1%的请求的服务时间超过该值。这个指标更专注于服务器处理请求的实际时间,包括请求在服务器端的处理、查询执行、文档检索等 |
离线外部集群性能测试
在线测试便于我们快速了解指定版本的ES性能参数,但实际使用过程中,我们通常都是离线下载测试数据集,然后指定已有的ES集群进行性能测试。
# 下载离线数据包
[root@es-test ~]# curl -O https://raw.githubusercontent.com/elastic/rally-tracks/master/download.sh
[root@es-test ~]# chmod u+x download.sh
[root@es-test ~]# ./download.sh geonames
[root@es-test ~]# tar -xf rally-track-data-geonames.tar
# 拉取rally镜像
[root@es-test ~]# docker pull elastic/rally:2.10.0
需要注意的是rally默认设置了默认number_of_shards和number_of_replicas参数,我们可以删除相关配置,然后通过索引模板灵活设置索引参数。
[root@es-test ~]# cd /root/.rally/benchmarks/tracks/default/geonames
[root@es-test geonames]# ls
README.md  __pycache__  challenges  files.txt  index.json operations  terms.txt  track.json  track.py
[root@es-test geonames]# vim index.json
# 删除如下两行设置
"index.number_of_shards": {{number_of_shards | default(5)}},
"index.number_of_replicas": {{number_of_replicas | default(0)}},
接下来设置索引模板,可参考文档https://www.cuiliangblog.cn/detail/section/110234776,针对写入性能进行参数优化。
PUT _template/geonames
{
  "index_patterns": [
    "geonames*"
  ],
  "order": 100,
  "settings": {
    "refresh_interval": "30s",
    "number_of_shards": "3",
    "translog": {
      "sync_interval": "30s",
      "durability": "async"
    },
    "number_of_replicas": "1"
  }
}
启动容器,指定es集群的ip地址,并传入账号密码和跳过证书验证参数,将结果以csv格式输出并导出到文件中。
[root@es-test ~]# useradd -u 1000 rally
[root@es-test ~]# chown -R rally:rally /root/.rally
[root@es-test ~]# docker run -v /root/.rally:/rally/.rally elastic/rally:2.10.0 race \
--offline --track-path=/rally/.rally/benchmarks/tracks/default/geonames \
--pipeline=benchmark-only \
--target-hosts="https://192.168.10.50:9200" \
--client-options="use_ssl:true,verify_certs:false,basic_auth_user:'elastic',basic_auth_password:'NAtPtHVns1LcO4NUTg41'" \
--report-format=csv \
--report-file=/rally/result.csv
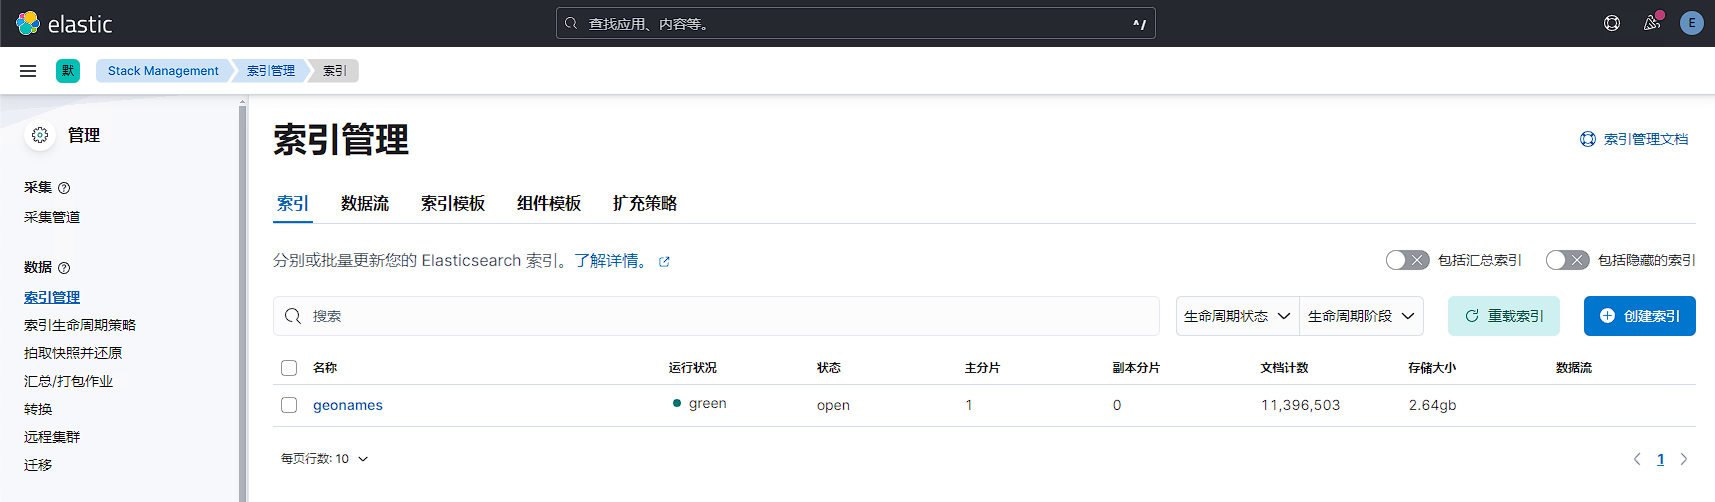
接下来查看kibana索引信息,已创建指定分片和副本的测试数据。
压测对比实践
测试环境
我们分别使用3套完全相同配置的3台机器组成es集群,所有集群设置相同的索引参数。分别测试es不同版本,不同部署方式下es性能差异具体为多少。
| 集群名 | es版本 | 部署方式 | 配置信息 | 操作系统与内核版本 |
|---|---|---|---|---|
| es-cluster1/3节点 | 8.12.2 | rpm | 4C8G50G(SSD) | Rocky Linux 8.9/4.18.0 |
| es-cluster2/3节点 | 8.12.2 | docker | 4C8G50G(SSD) | Rocky Linux 8.9/4.18.0 |
| es-cluster3/3节点 | 7.17.18 | rpm | 4C8G50G(SSD) | Rocky Linux 8.9/4.18.0 |
测试结果
由于测试结果项较多,此处不详细展示,测试结果文件已上传至网盘,有需要的可自行下载查看。
ES压测结果.xlsx
挑选几个重要指标进行对比,结果如下:
| 指标 | docker-8.12.2 | rpm-8.12.2 | rpm-7.17.18 |
|---|---|---|---|
| 最大索引吞吐量(docs/s) | 40671.03 | 51065.85 | 44341.6 |
| term查询最大延迟(ms) | 35.901875 | 18.676184 | 22.832434 |
| scroll查询最大延迟(ms) | 700.778035 | 310.298231 | 406.003485 |
| 排序查询最大延迟(ms) | 18.52360867 | 9.996094999 | 11.29074433 |
| 聚合查询最大延迟(ms) | 246.29214 | 217.2186607 | 230.9802593 |
以docker-8.12.2性能指标为基准来看,rpm-8.12.2和rpm-7.17.18性能提升值如下:
- 最大索引吞吐量(docs/s):
- rpm-8.12.2:((51065.85 - 40671.03) / 40671.03) * 100% ≈ 25.59%
- rpm-7.17.18:((44341.6 - 40671.03) / 40671.03) * 100% ≈ 9.05%
- term查询最大延迟(ms):
- rpm-8.12.2:((18.676184 - 35.901875) / 35.901875) * 100% ≈ -47.97%
- rpm-7.17.18:((22.832434 - 35.901875) / 35.901875) * 100% ≈ -36.40%
- scroll查询最大延迟(ms):
- rpm-8.12.2:((310.298231 - 700.778035) / 700.778035) * 100% ≈ -55.69%
- rpm-7.17.18:((406.003485 - 700.778035) / 700.778035) * 100% ≈ -42.00%
- 排序查询最大延迟(ms):
- rpm-8.12.2:((9.996094999 - 18.52360867) / 18.52360867) * 100% ≈ -45.97%
- rpm-7.17.18:((11.29074433 - 18.52360867) / 18.52360867) * 100% ≈ -38.99%
- 聚合查询最大延迟(ms):
- rpm-8.12.2:((217.2186607 - 246.29214) / 246.29214) * 100% ≈ -11.79%
- rpm-7.17.18:((230.9802593 - 246.29214) / 246.29214) * 100% ≈ -6.24%
测试结论
通过压测可知在k8s部署的es服务无论在写入还是读取数据时,性能都低于rpm方式运行的es。
rpm方式部署的es8相较于es7,写入性能提升16%,读取性能提升5-13%。
因此在部署es集群时,优先选择rpm方式部署es8版本集群,当集群规模更大时,为减轻运维工作,再考虑迁移至k8s容器运行es集群。
参考文档
离线数据下载
https://esrally.readthedocs.io/en/latest/offline.html
命令行参数
https://esrally.readthedocs.io/en/latest/command_line_reference.html?highlight=–client-options#command-line-flags
查看更多
微信公众号
微信公众号同步更新,欢迎关注微信公众号《崔亮的博客》第一时间获取最近文章。
博客网站
崔亮的博客-专注devops自动化运维,传播优秀it运维技术文章。更多原创运维开发相关文章,欢迎访问https://www.cuiliangblog.cn


 829
829


 被折叠的 条评论
为什么被折叠?
被折叠的 条评论
为什么被折叠?
 到【灌水乐园】发言


