


大家好,本文是对腾讯热播剧《开端》的一次爬虫与数据分析,耗时一个小时,总爬取条数3W条评论,很适合新人练手,值得注意的一点是评论的情绪文本分析处理,这是第一次接触的知识。喜欢记得收藏、点赞、关注。代码文末找我获取。
本文内容如下:
-
如何查找视频id
-
项目结构
-
制作词云图
-
制作最近评论数条形图与折线图
-
制作每小时评论条形图与折线图
-
制作最近评论数饼图
-
制作每小时评论饼图
-
制作观看时间区间评论统计饼图
-
制作开端主演提及占比饼图
-
制作评论内容情感分析图
-
评论的时间戳转换为正常时间
-
评论内容读入CSV
-
统计一天各个时间段内的评论数
-
统计最近评论数
-
爬取评论内容
-
爬取评论时间

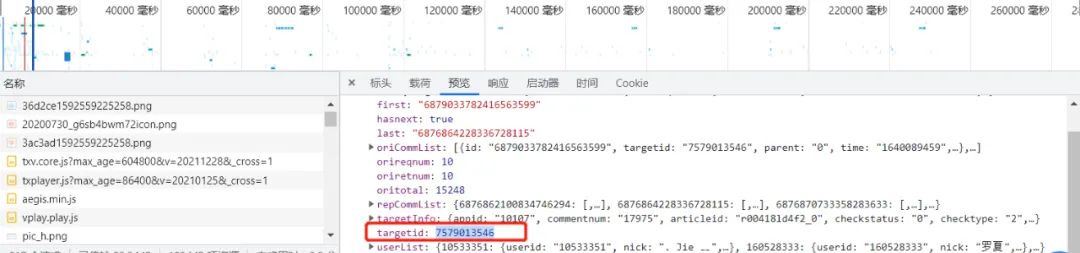
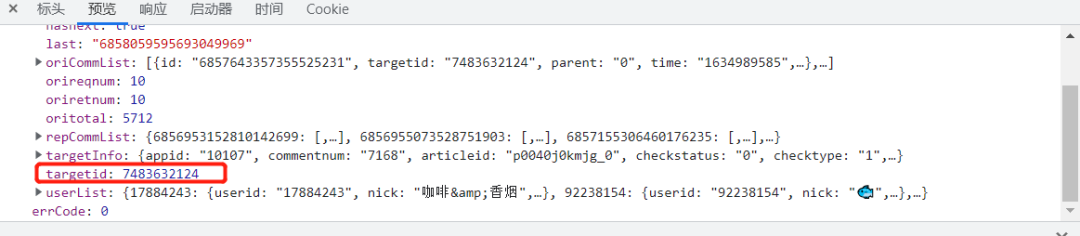
爬虫方面:由于腾讯的评论数据是封装在json里面,所以只需要找到json文件,对需要的数据进行提取保存即可。

-
视频网址:https://v.qq.com/x/cover/mzc00200mp8vo9b.html
-
评论json数据网址:https://video.coral.qq.com/varticle/7625787154/comment/v2
-
注:只要替换视频数字id的值,即可爬取其他视频的评论
干货推荐
- 深度盘点:这20套可视化炫酷大屏真香啊(附源码)
- 值得收藏,这6种制作竞赛动图的方法妙不可言
- 绝了,这6个精挑细选的机器学习资料简直太香了
- Python数据分析三剑客真香啊,还有高清思维导图
- Python编程从入门到实战,看这一篇足够了
如何查找视频id?
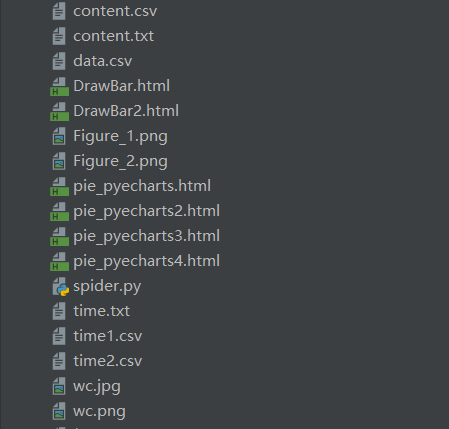
项目结构:
一. 爬虫部分:
1.爬取评论内容代码:spiders.py
import requests
import re
import random

def get_html(url, params):
    uapools = [
        'Mozilla/5.0 (Macintosh; Intel Mac OS X 10_9_2) AppleWebKit/537.36 (KHTML, like Gecko) Chrome/35.0.1916.153 Safari/537.36',
        'Mozilla/5.0 (Windows NT 6.1; WOW64; rv:30.0) Gecko/20100101 Firefox/30.0',
        'Mozilla/5.0 (Macintosh; Intel Mac OS X 10_9_2) AppleWebKit/537.75.14 (KHTML, like Gecko) Version/7.0.3 Safari/537.75.14'
    ]

    thisua = random.choice(uapools)
    headers = {"User-Agent": thisua}
    r = requests.get(url, headers=headers, params=params)
    r.raise_for_status()
    r.encoding = r.apparent_encoding
    r.encoding = 'utf-8'# 不加此句出现乱码
    return r.text

def parse_page(infolist, data):
    commentpat = '"content":"(.*?)"'
    lastpat = '"last":"(.*?)"'
    commentall = re.compile(commentpat, re.S).findall(data)
    next_cid = re.compile(lastpat).findall(data)[0]
    infolist.append(commentall)
    return next_cid


def print_comment_list(infolist):
    j = 0
    for page in infolist:
        print('第' + str(j + 1) + '页\n')
        commentall = page
        for i in range(0, len(commentall)):
            print(commentall[i] + '\n')
        j += 1


def save_to_txt(infolist, path):
    fw = open(path, 'w+', encoding='utf-8')
    j = 0
    for page in infolist:
        #fw.write('第' + str(j + 1) + '页\n')
        commentall = page
        for i in range(0, len(commentall)):
            fw.write(commentall[i] + '\n')
        j += 1
    fw.close()


def main():
    infolist = []
    vid = '7579013546';
    cid = "0";
    page_num = 3000
    url = 'https://video.coral.qq.com/varticle/' + vid + '/comment/v2'
    #print(url)

    for i in range(page_num):
        params = {'orinum': '10', 'cursor': cid}
        html = get_html(url, params)
        cid = parse_page(infolist, html)


    print_comment_list(infolist)
    save_to_txt(infolist, 'content.txt')


main()
2.爬取评论时间代码:sp.py
import requests
import re
import random


def get_html(url, params):
    uapools = [
        'Mozilla/5.0 (Macintosh; Intel Mac OS X 10_9_2) AppleWebKit/537.36 (KHTML, like Gecko) Chrome/35.0.1916.153 Safari/537.36',
        'Mozilla/5.0 (Windows NT 6.1; WOW64; rv:30.0) Gecko/20100101 Firefox/30.0',
        'Mozilla/5.0 (Macintosh; Intel Mac OS X 10_9_2) AppleWebKit/537.75.14 (KHTML, like Gecko) Version/7.0.3 Safari/537.75.14'
    ]

    thisua = random.choice(uapools)
    headers = {"User-Agent": thisua}
    r = requests.get(url, headers=headers, params=params)
    r.raise_for_status()
    r.encoding = r.apparent_encoding
    r.encoding = 'utf-8'# 不加此句出现乱码
    return r.text


def parse_page(infolist, data):
    commentpat = '"time":"(.*?)"'
    lastpat = '"last":"(.*?)"'

    commentall = re.compile(commentpat, re.S).findall(data)
    next_cid = re.compile(lastpat).findall(data)[0]

    infolist.append(commentall)

    return next_cid


def print_comment_list(infolist):
    j = 0
    for page in infolist:
        print('第' + str(j + 1) + '页\n')
        commentall = page
        for i in range(0, len(commentall)):
            print(commentall[i] + '\n')
        j += 1


def save_to_txt(infolist, path):
    fw = open(path, 'w+', encoding='utf-8')
    j = 0
    for page in infolist:
        #fw.write('第' + str(j + 1) + '页\n')
        commentall = page
        for i in range(0, len(commentall)):
            fw.write(commentall[i] + '\n')
        j += 1
    fw.close()


def main():
    infolist = []
    vid = '7579013546';
    cid = "0";
    page_num =3000
    url = 'https://video.coral.qq.com/varticle/' + vid + '/comment/v2'
    #print(url)

    for i in range(page_num):
        params = {'orinum': '10', 'cursor': cid}
        html = get_html(url, params)
        cid = parse_page(infolist, html)


    print_comment_list(infolist)
    save_to_txt(infolist, 'time.txt')


main()
二.数据处理部分
1.评论的时间戳转换为正常时间 time.py
# coding=gbk
import csv
import time

csvFile = open("data.csv",'w',newline='',encoding='utf-8')
writer = csv.writer(csvFile)
csvRow = []
#print(csvRow)
f = open("time.txt",'r',encoding='utf-8')
for line in f:
    csvRow = int(line)
    #print(csvRow)

    timeArray = time.localtime(csvRow)
    csvRow = time.strftime("%Y-%m-%d %H:%M:%S", timeArray)
    print(csvRow)
    csvRow = csvRow.split()
    writer.writerow(csvRow)

f.close()
csvFile.close()
2.评论内容读入csv CD.py
# coding=gbk
import csv
csvFile = open("content.csv",'w',newline='',encoding='utf-8')
writer = csv.writer(csvFile)
csvRow = []

f = open("content.txt",'r',encoding='utf-8')
for line in f:
    csvRow = line.split()
    writer.writerow(csvRow)

f.close()
csvFile.close()
3.统计一天各个时间段内的评论数 py.py
# coding=gbk
import csv

from pyecharts import options as opts
from sympy.combinatorics import Subset
from wordcloud import WordCloud

with open('../Spiders/data.csv') as csvfile:
    reader = csv.reader(csvfile)

    data1 = [str(row[1])[0:2] for row in reader]

    print(data1)
print(type(data1))


#先变成集合得到seq中的所有元素,避免重复遍历
set_seq = set(data1)
rst = []
for item in set_seq:
    rst.append((item,data1.count(item)))  #添加元素及出现个数
rst.sort()
print(type(rst))
print(rst)

with open("time2.csv", "w+", newline='', encoding='utf-8') as f:
    writer = csv.writer(f, delimiter=',')
    for i in rst:                # 对于每一行的,将这一行的每个元素分别写在对应的列中
        writer.writerow(i)

with open('time2.csv') as csvfile:
     reader = csv.reader(csvfile)
     x = [str(row[0]) for row in reader]
     print(x)
with open('time2.csv') as csvfile:
    reader = csv.reader(csvfile)
    y1 = [float(row[1]) for row in reader]
    print(y1)
4.统计最近评论数 py1.py
# coding=gbk
import csv

from pyecharts import options as opts
from sympy.combinatorics import Subset
from wordcloud import WordCloud

with open('../Spiders/data.csv') as csvfile:
    reader = csv.reader(csvfile)

    data1 = [str(row[0]) for row in reader]
    #print(data1)
print(type(data1))


#先变成集合得到seq中的所有元素,避免重复遍历
set_seq = set(data1)
rst = []
for item in set_seq:
    rst.append((item,data1.count(item)))  #添加元素及出现个数
rst.sort()
print(type(rst))
print(rst)


with open("time1.csv", "w+", newline='', encoding='utf-8') as f:
    writer = csv.writer(f, delimiter=',')
    for i in rst:                # 对于每一行的,将这一行的每个元素分别写在对应的列中
        writer.writerow(i)

with open('time1.csv') as csvfile:
     reader = csv.reader(csvfile)
     x = [str(row[0]) for row in reader]
     print(x)
with open('time1.csv') as csvfile:
    reader = csv.reader(csvfile)
    y1 = [float(row[1]) for row in reader]

    print(y1)
三. 数据分析
数据分析方面:涉及到了词云图,条形,折线,饼图,后三者是对评论时间与主演占比的分析,然而腾讯的评论时间是以时间戳的形式显示,所以要进行转换,再去统计出现次数,最后,新加了对评论内容的情感分析。
1.制作词云图
wc.py
import numpy as np
import re
import jieba
from wordcloud import WordCloud
from matplotlib import pyplot as plt
from PIL import Image

# 上面的包自己安装,不会的就百度

f = open('content.txt', 'r', encoding='utf-8')  # 这是数据源,也就是想生成词云的数据
txt = f.read()  # 读取文件
f.close()  # 关闭文件,其实用with就好,但是懒得改了
# 如果是文章的话,需要用到jieba分词,分完之后也可以自己处理下再生成词云
newtxt = re.sub("[A-Za-z0-9\!\%\[\]\,\。]", "", txt)
print(newtxt)
words = jieba.lcut(newtxt)

img = Image.open(r'wc.jpg')  # 想要搞得形状
img_array = np.array(img)

# 相关配置,里面这个collocations配置可以避免重复
wordcloud = WordCloud(
    background_color="white",
    width=1080,
    height=960,
    font_path="../文悦新青年.otf",
    max_words=150,
    scale=10,#清晰度
    max_font_size=100,
    mask=img_array,
    collocations=False).generate(newtxt)

plt.imshow(wordcloud)
plt.axis('off')
plt.show()
wordcloud.to_file('wc.png')
词云图:result.png (注:这里要把英文字母过滤掉)

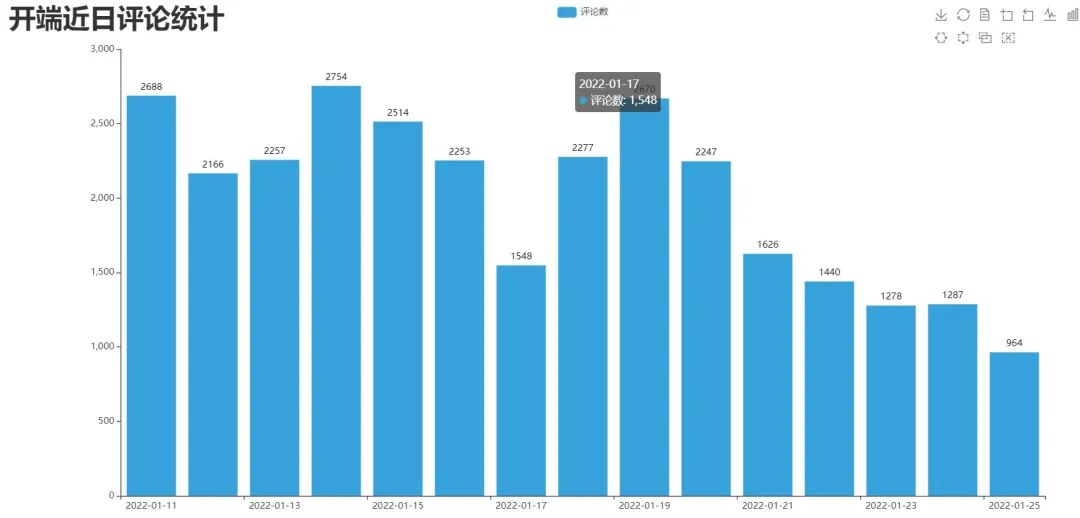
2.制作最近评论数条形图 DrawBar.py
# encoding: utf-8
import csv
import pyecharts.options as opts
from pyecharts.charts import Bar
from pyecharts.globals import ThemeType


class DrawBar(object):

    """绘制柱形图类"""
    def __init__(self):
        """创建柱状图实例,并设置宽高和风格"""
        self.bar = Bar(init_opts=opts.InitOpts(width='1500px', height='700px', theme=ThemeType.LIGHT))

    def add_x(self):
        """为图形添加X轴数据"""
        with open('time1.csv') as csvfile:
            reader = csv.reader(csvfile)
            x = [str(row[0]) for row in reader]
            print(x)


        self.bar.add_xaxis(
            xaxis_data=x,

        )

    def add_y(self):
        with open('time1.csv') as csvfile:
            reader = csv.reader(csvfile)
            y1 = [float(row[1]) for row in reader]

            print(y1)


        """为图形添加Y轴数据,可添加多条"""
        self.bar.add_yaxis(  # 第一个Y轴数据
            series_name="评论数",  # Y轴数据名称
            y_axis=y1,  # Y轴数据
            label_opts=opts.LabelOpts(is_show=True,color="black"),  # 设置标签
            bar_max_width='100px',  # 设置柱子最大宽度
        )


    def set_global(self):
        """设置图形的全局属性"""
        #self.bar(width=2000,height=1000)
        self.bar.set_global_opts(
            title_opts=opts.TitleOpts(  # 设置标题
                title='开端近日评论统计',title_textstyle_opts=opts.TextStyleOpts(font_size=35)

            ),
            tooltip_opts=opts.TooltipOpts(  # 提示框配置项(鼠标移到图形上时显示的东西)
                is_show=True,  # 是否显示提示框
                trigger="axis",  # 触发类型(axis坐标轴触发,鼠标移到时会有一条垂直于X轴的实线跟随鼠标移动,并显示提示信息)
                axis_pointer_type="cross"# 指示器类型(cross将会生成两条分别垂直于X轴和Y轴的虚线,不启用trigger才会显示完全)
            ),
            toolbox_opts=opts.ToolboxOpts(),  # 工具箱配置项(什么都不填默认开启所有工具)

        )

    def draw(self):
        """绘制图形"""

        self.add_x()
        self.add_y()
        self.set_global()
        self.bar.render('../Html/DrawBar.html')  # 将图绘制到 test.html 文件内,可在浏览器打开
    def run(self):
        """执行函数"""
        self.draw()


if __name__ == '__main__':
    app = DrawBar()

app.run()
效果图:DrawBar.html
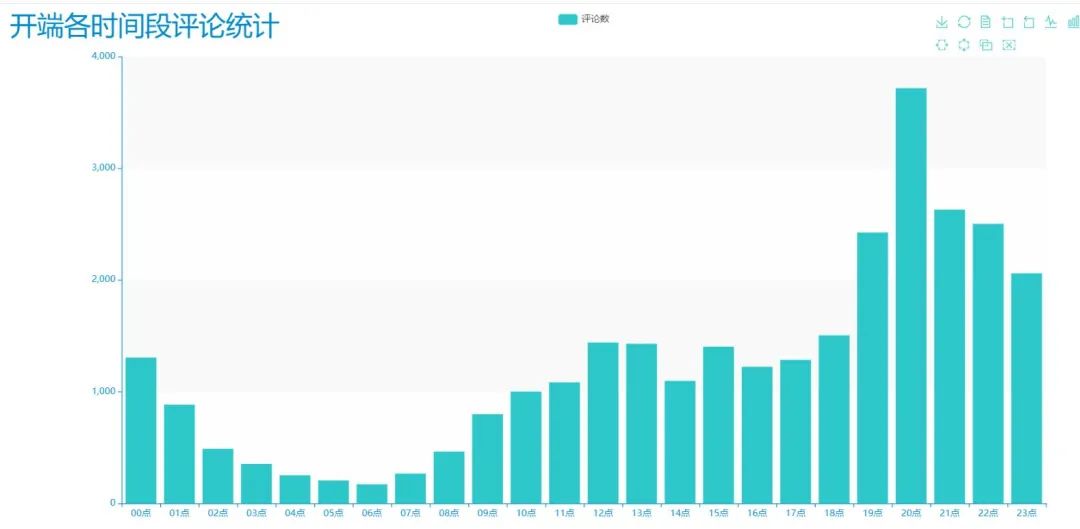
3.制作每小时评论条形图 DrawBar2.py
# encoding: utf-8
# encoding: utf-8
import csv
import pyecharts.options as opts
from pyecharts.charts import Bar
from pyecharts.globals import ThemeType


class DrawBar(object):

    """绘制柱形图类"""
    def __init__(self):
        """创建柱状图实例,并设置宽高和风格"""
        self.bar = Bar(init_opts=opts.InitOpts(width='1500px', height='700px', theme=ThemeType.MACARONS))

    def add_x(self):
        """为图形添加X轴数据"""
        str_name1 = '点'

        with open('time2.csv') as csvfile:
            reader = csv.reader(csvfile)
            x = [str(row[0] + str_name1) for row in reader]
            print(x)


        self.bar.add_xaxis(
            xaxis_data=x
        )

    def add_y(self):
        with open('time2.csv') as csvfile:
            reader = csv.reader(csvfile)
            y1 = [int(row[1]) for row in reader]

            print(y1)


        """为图形添加Y轴数据,可添加多条"""
        self.bar.add_yaxis(  # 第一个Y轴数据
            series_name="评论数",  # Y轴数据名称
            y_axis=y1,  # Y轴数据
            label_opts=opts.LabelOpts(is_show=False),  # 设置标签
            bar_max_width='50px',  # 设置柱子最大宽度

        )


    def set_global(self):
        """设置图形的全局属性"""
        #self.bar(width=2000,height=1000)
        self.bar.set_global_opts(
            title_opts=opts.TitleOpts(  # 设置标题
                title='开端各时间段评论统计',title_textstyle_opts=opts.TextStyleOpts(font_size=35)

            ),
            tooltip_opts=opts.TooltipOpts(  # 提示框配置项(鼠标移到图形上时显示的东西)
                is_show=True,  # 是否显示提示框
                trigger="axis",  # 触发类型(axis坐标轴触发,鼠标移到时会有一条垂直于X轴的实线跟随鼠标移动,并显示提示信息)
                axis_pointer_type="cross"# 指示器类型(cross将会生成两条分别垂直于X轴和Y轴的虚线,不启用trigger才会显示完全)
            ),
            toolbox_opts=opts.ToolboxOpts(),  # 工具箱配置项(什么都不填默认开启所有工具)

        )

    def draw(self):
        """绘制图形"""

        self.add_x()
        self.add_y()
        self.set_global()
        self.bar.render('../Html/DrawBar2.html')  # 将图绘制到 test.html 文件内,可在浏览器打开
    def run(self):
        """执行函数"""
        self.draw()

if __name__ == '__main__':
    app = DrawBar()

app.run()
效果图:DrawBar2.html
4.制作近日评论数饼图 pie_pyecharts.py
import csv
from pyecharts import options as opts
from pyecharts.charts import Pie
from random import randint
from pyecharts.globals import ThemeType
with open('time1.csv') as csvfile:
    reader = csv.reader(csvfile)
    x = [str(row[0]) for row in reader]
    print(x)
with open('time1.csv') as csvfile:
    reader = csv.reader(csvfile)
    y1 = [float(row[1]) for row in reader]
    print(y1)
num = y1
lab = x
(
    Pie(init_opts=opts.InitOpts(width='1700px',height='450px',theme=ThemeType.LIGHT))#默认900,600
    .set_global_opts(
        title_opts=opts.TitleOpts(title="开端近日评论统计",
                                               title_textstyle_opts=opts.TextStyleOpts(font_size=27)),legend_opts=opts.LegendOpts(

            pos_top="10%", pos_left="1%",# 图例位置调整
            ),)
    .add(series_name='',center=[280, 270], data_pair=[(j, i) for i, j in zip(num, lab)])#饼图
   .add(series_name='',center=[845, 270],data_pair=[(j,i) for i,j in zip(num,lab)],radius=['40%','75%'])#环图
    .add(series_name='', center=[1380, 270],data_pair=[(j, i) for i, j in zip(num, lab)], rosetype='radius')#南丁格尔图
).render('pie_pyecharts.html')
效果图

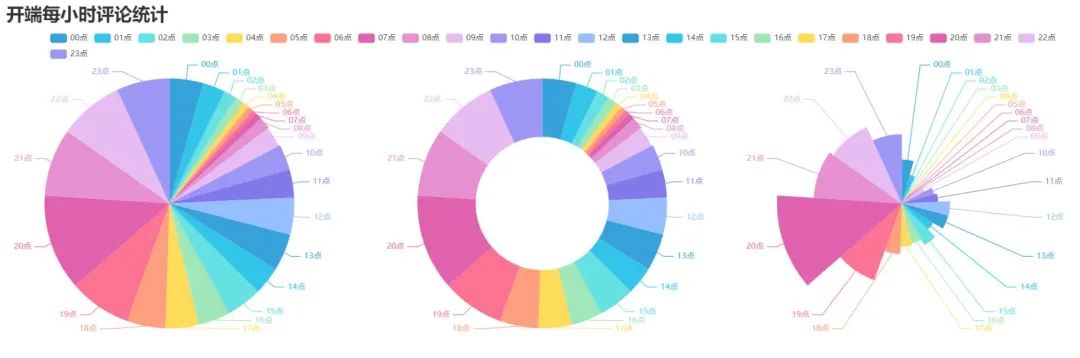
5.制作每小时评论饼图 pie_pyecharts2.py
import csv
from pyecharts import options as opts
from pyecharts.charts import Pie
from random import randint
from pyecharts.globals import ThemeType

str_name1 = '点'
with open('time2.csv') as csvfile:
    reader = csv.reader(csvfile)
    x = [str(row[0]+str_name1) for row in reader]
    print(x)
with open('time2.csv') as csvfile:
    reader = csv.reader(csvfile)
    y1 = [int(row[1]) for row in reader]

    print(y1)
num = y1
lab = x
(
    Pie(init_opts=opts.InitOpts(width='1650px',height='500px',theme=ThemeType.LIGHT,))#默认900,600
     .set_global_opts(
        title_opts=opts.TitleOpts(title="开端每小时评论统计"
                                  ,title_textstyle_opts=opts.TextStyleOpts(font_size=27)),
        legend_opts=opts.LegendOpts(

            pos_top="8%", pos_left="4%",# 图例位置调整
            ),
    )
    .add(series_name='',center=[250, 300], data_pair=[(j, i) for i, j in zip(num, lab)])#饼图
    .add(series_name='',center=[810, 300],data_pair=[(j,i) for i,j in zip(num,lab)],radius=['40%','75%'])#环图
    .add(series_name='', center=[1350, 300],data_pair=[(j, i) for i, j in zip(num, lab)], rosetype='radius')#南丁格尔图
).render('pie_pyecharts2.html')
效果图
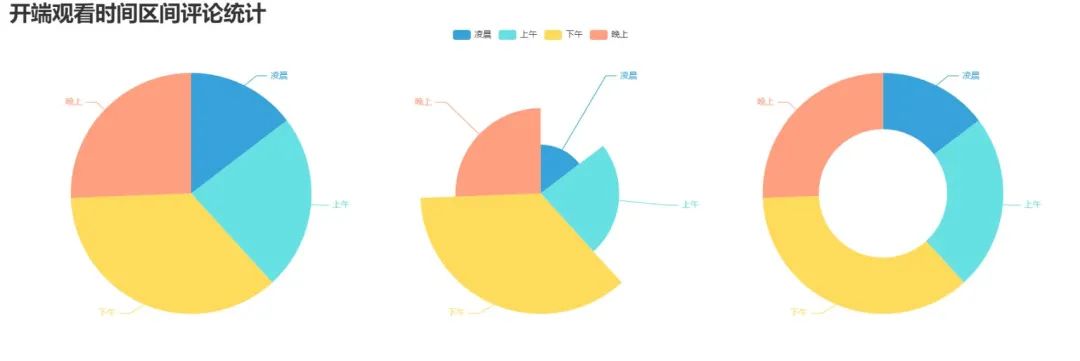
6.制作观看时间区间评论统计饼图 pie_pyecharts3.py
# coding=gbk
import csv
from pyecharts import options as opts
from pyecharts.globals import ThemeType
from sympy.combinatorics import Subset
from wordcloud import WordCloud
from pyecharts.charts import Pie
from random import randint
with open(/data.csv') as csvfile:
    reader = csv.reader(csvfile)
    data2 = [int(row[1].strip('')[0:2]) for row in reader]
    #print(data2)
print(type(data2))
#先变成集合得到seq中的所有元素,避免重复遍历
set_seq = set(data2)
list = []
for item in set_seq:
    list.append((item,data2.count(item)))  #添加元素及出现个数
list.sort()
print(type(list))
#print(list)
with open("time2.csv", "w+", newline='', encoding='utf-8') as f:
    writer = csv.writer(f, delimiter=',')
    for i in list:                # 对于每一行的,将这一行的每个元素分别写在对应的列中
        writer.writerow(i)
n = 4#分成n组
m = int(len(list)/n)
list2 = []
for i in range(0, len(list), m):
    list2.append(list[i:i+m])

print("凌晨 : ",list2[0])
print("上午 : ",list2[1])
print("下午 : ",list2[2])
print("晚上 : ",list2[3])

with open('time2.csv') as csvfile:
    reader = csv.reader(csvfile)
    y1 = [int(row[1]) for row in reader]

    print(y1)

n =6
groups = [y1[i:i + n] for i in range(0, len(y1), n)]

print(groups)

x=['凌晨','上午','下午','晚上']
y1=[]
for y1 in groups:
    num_sum = 0
    for groups in y1:
        num_sum += groups
str_name1 = '点'
num = y1
lab = x
(
    Pie(init_opts=opts.InitOpts(width='1500px',height='450px',theme=ThemeType.LIGHT))#默认900,600
        .set_global_opts(
        title_opts=opts.TitleOpts(title="开端观看时间区间评论统计"
                                  , title_textstyle_opts=opts.TextStyleOpts(font_size=30)),
        legend_opts=opts.LegendOpts(

            pos_top="8%",  # 图例位置调整
        ),
    )
    .add(series_name='',center=[260, 270], data_pair=[(j, i) for i, j in zip(num, lab)])#饼图
   .add(series_name='',center=[1230, 270],data_pair=[(j,i) for i,j in zip(num,lab)],radius=['40%','75%'])#环图
    .add(series_name='', center=[750, 270],data_pair=[(j, i) for i, j in zip(num, lab)], rosetype='radius')#南丁格尔图
).render('pie_pyecharts3.html')
效果图
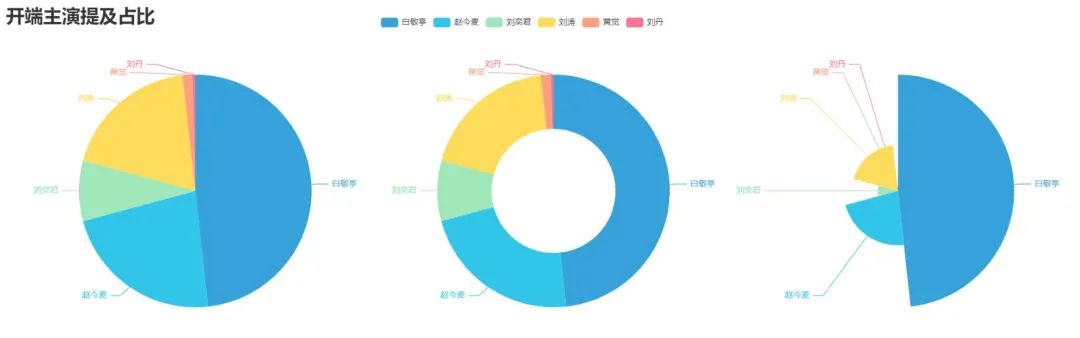
7.制作开端主演提及占比饼图 pie_pyecharts4.py
from pyecharts import options as opts
from pyecharts.charts import Pie
from pyecharts.globals import ThemeType

# 上面的包自己安装,不会的就百度

f = open('content.txt', 'r', encoding='utf-8')  # 这是数据源,也就是想生成词云的数据
words = f.read()  # 读取文件
f.close()  # 关闭文件,其实用with就好,但是懒得改了

name=["白敬亭","赵今麦","刘奕君","刘涛","黄觉","刘丹"]

print(name)
count=[float(words.count("白敬亭")),
      float(words.count("赵今麦")),
      float(words.count("刘奕君")),
    float(words.count("刘涛")),
    float(words.count("黄觉")),
    float(words.count("刘丹"))]
print(count)

num = count
lab = name
(
    Pie(init_opts=opts.InitOpts(width='1650px',height='450px',theme=ThemeType.LIGHT))#默认900,600
    .set_global_opts(
        title_opts=opts.TitleOpts(title="开端主演提及占比",
                                               title_textstyle_opts=opts.TextStyleOpts(font_size=27)),legend_opts=opts.LegendOpts(

            pos_top="3%", pos_left="33%",# 图例位置调整
            ),)
    .add(series_name='',center=[280, 270], data_pair=[(j, i) for i, j in zip(num, lab)])#饼图
   .add(series_name='',center=[800, 270],data_pair=[(j,i) for i,j in zip(num,lab)],radius=['40%','75%'])#环图
    .add(series_name='', center=[1300, 270],data_pair=[(j, i) for i, j in zip(num, lab)], rosetype='radius')#南丁格尔图
).render('pie_pyecharts4.html')
效果图
8.评论内容情感分析 SnowNLP.py
import numpy as np
from snownlp import SnowNLP
import matplotlib.pyplot as plt

f = open('content.txt', 'r', encoding='UTF-8')
list = f.readlines()
sentimentslist = []
for i in list:
    s = SnowNLP(i)

    print(s.sentiments)
    sentimentslist.append(s.sentiments)
plt.hist(sentimentslist, bins=np.arange(0, 1, 0.01), facecolor='g')
plt.xlabel('Sentiments Probability')
plt.ylabel('Quantity')
plt.title('Analysis of Sentiments')
plt.show()
效果图(情感各分数段出现频率)
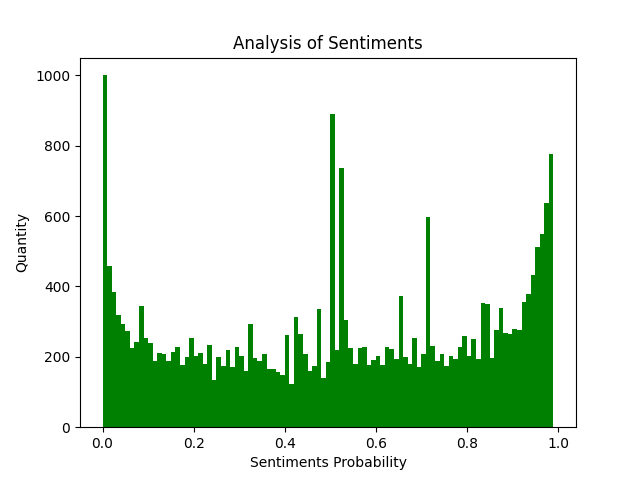
SnowNLP情感分析是基于情感词典实现的,其简单的将文本分为两类,积极和消极,返回值为情绪的概率,也就是情感评分在[0,1]之间,越接近1,情感表现越积极,越接近0,情感表现越消极。
04、总结
1. 本文详细介绍了如何爬取腾讯视频评论并进行可视化分析,读者可以自行动手尝试。
2. 本文十分适合小白进行练手。
3. 本文仅供学习参考,不做它用。
技术交流
欢迎转载、收藏、有所收获点赞支持一下!
目前开通了技术交流群,群友已超过1000人,添加时最好的备注方式为:来源+兴趣方向,方便找到志同道合的朋友
- 方式①、发送如下图片至微信,长按识别,后台回复:加群;
- 方式②、添加微信号:dkl88191,备注:来自CSDN
- 方式③、微信搜索公众号:Python学习与数据挖掘,后台回复:加群


 2215
2215


 被折叠的 条评论
为什么被折叠?
被折叠的 条评论
为什么被折叠?
 到【灌水乐园】发言


