


一、什么是canvas
Canvas 是 HTML5 新增的元素,它就像一块幕布,可通过JavaScript脚本在 Web 页面上绘制图形、动画和其他可视化内容。
二、canvas用法
<!--1.创建画布-->
<canvas id="myCanvas"></canvas> // 如果没有设置宽高,那么会自动创建一个 300 * 150 的画布(单位默认为 px)


// 2.获取绘图上下文
const canvas = document.getElementById('myCanvas')  // 获取画布节点

const ctx = canvas.getContext('2d') // 代表一个二维渲染上下文


// 3.设置绘制属性
canvas.width = 500    // 设置画布宽度

canvas.height = 500   // 设置画布高度

ctx.fillText('我是文本', 30, 20)  // 绘制文本内容和坐标

ctx.fillStyle = 'red' // 设置填充颜色

ctx.font = '18px Arial'  // 设置文本大小和字体

ctx.textAlign = 'center' // 设置水平对齐方式

ctx.textBaseline = "middle" // 设置垂直对齐方式

ctx.setLineDash([5, 5]) // 设置虚线

ctx.lineWidth = 2     // 设置线条宽度为2像素

// 4.绘制矩形
ctx.fillRect(10, 10, 10, 10)    // 绘制填充矩形

ctx.strokeRect(70, 10, 50, 50)  // 绘制描边矩形

// 5.绘制路径
ctx.beginPath()  // 开始新路径

ctx.moveTo(100, 100) // 移动到起始点

ctx.lineTo(150, 150) // 创建直线路径

ctx.lineTo(200, 100) // 创建直线路径

ctx.closePath()  // 关闭路径

ctx.stroke()  // 描边路径

ctx.fill() // 填充路径

// 6.清除画布内容
ctx.clearRect(0, 0, canvas.width, canvas.height)
canvas 常用方法如下:
| 方法 | 描述 | 示例 |
|---|---|---|
| getContext('2d') | 获取 2D 绘图上下文对象 | const ctx = canvas.getContext('2d'); |
| beginPath() | 开始一个新的路径 | ctx.beginPath(); |
| moveTo(x, y) | 将路径移动到指定的坐标点 | ctx.moveTo(100, 100); |
| lineTo(x, y) | 添加一条从当前位置到指定坐标点的直线 | ctx.lineTo(200, 200); |
| closePath() | 闭合路径 | ctx.closePath(); |
| stroke() | 绘制路径的描边 | ctx.stroke(); |
| fill() | 填充路径 | ctx.fill(); |
| fillRect(x, y, width, height) | 绘制填充矩形 | ctx.fillRect(10, 10, 50, 50); |
| strokeRect(x, y, width, height) | 绘制描边矩形 | ctx.strokeRect(10, 10, 50, 50); |
| clearRect(x, y, width, height) | 清除指定矩形区域的内容 | ctx.clearRect(0, 0, canvas.width, canvas.height); |
| strokeText(text, x, y) | 在指定位置给文本描边 | ctx.strokeText('hello', 50, 60) |
| fillText(text, x, y) | 在指定位置绘制填充文本 | ctx.fillText('Hello, Canvas!', 50, 50); |
| font | 设置当前文本样式 | ctx.font = '20px Arial'; |
| fillStyle | 设置绘图的填充颜色或样式 | ctx.fillStyle = 'red'; |
| strokeStyle | 设置绘图的描边颜色或样式 | ctx.strokeStyle = 'blue'; |
| lineWidth | 设置描边线条的宽度 | ctx.lineWidth = 2; |
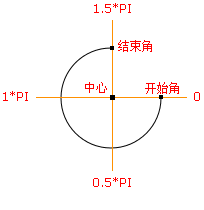
| arc(x, y, radius, startAngle, endAngle, anticlockwise) | 创建弧形路径 | ctx.arc(100, 100, 50, 0, Math.PI * 2, false); x,y表示圆心坐标 r 表示圆的半径 startAngle : 表示开始绘制的角度 endAngle : 表示结束绘制的角度 anticlockwise:false顺时针,true逆时针,默认false |
| drawImage(image, x, y) | 在指定位置绘制图像 | ctx.drawImage(image, 0, 0); |
| save() | 保存当前绘图上下文的状态 | ctx.save(); |
| restore() | 恢复之前保存的绘图上下文的状态 | ctx.restore(); |
三、绘制案例
1.绘制直线
<canvas id="myCanvas"></canvas>

const canvas = document.getElementById('myCanvas')

const ctx = canvas.getContext('2d')

// 设置直线样式
ctx.strokeStyle = 'red'  // 设置线条颜色为红色
ctx.lineWidth = 2       // 设置线条宽度为2像素

// 绘制直线
ctx.beginPath()
ctx.moveTo(50, 130) // 设置直线起点坐标
ctx.lineTo(260, 130) // 设置直线终点坐标
ctx.stroke() // 绘制直线

// 添加备注
ctx.fillStyle = 'red'
ctx.font = '18px Arial'
ctx.fillText('canvas绘制直线', 60, 200)

2.绘制曲线
<canvas id="myCanvas" width="500" height="500"></canvas>

const canvas = document.getElementById('myCanvas')

const ctx = canvas.getContext('2d')

// 设置曲线样式
ctx.strokeStyle = 'blue';  // 设置线条颜色为蓝色
ctx.lineWidth = 2;        // 设置线条宽度为2像素

// 绘制二次贝塞尔曲线
ctx.beginPath();
ctx.moveTo(50, 200);  // 设置曲线起点坐标
ctx.quadraticCurveTo(150, 50, 250, 200);  // 设置控制点坐标和终点坐标
ctx.stroke();  // 绘制曲线

// 添加备注
ctx.fillStyle = 'black';
ctx.font = '14px Arial';
ctx.fillText('二次贝塞尔曲线', 100, 100);

3.绘制矩形
<canvas id="myCanvas"></canvas>

const canvas = document.getElementById('myCanvas')

const ctx = canvas.getContext('2d')

ctx.strokeStyle = 'red'

ctx.beginPath() // 开始绘制

ctx.strokeRect(50, 100, 200, 100) // 参数(x轴坐标, y轴坐标, w宽度, h高度)

ctx.closePath()

4.绘制圆形
<canvas id="myCanvas"></canvas>

const canvas = document.getElementById('myCanvas')

const ctx = canvas.getContext('2d')

// 绘制圆形
ctx.beginPath()  // 开始路径

ctx.arc(100, 100, 50, 0, 2*Math.PI) // 参数为 (x, y, radius, startAngle, endAngle)

ctx.fillStyle = 'red'  // 设置颜色

ctx.fill()  // 填充路径

ctx.closePath()  // 闭合路径
5.绘制三角形
<canvas id="myCanvas" width="500" height="500"></canvas>

const canvas = document.getElementById('myCanvas')
const ctx = canvas.getContext('2d')

// 设置三角形样式
ctx.fillStyle = 'red'  // 设置填充颜色为红色

// 绘制三角形
ctx.beginPath();
ctx.moveTo(150, 100)  // 设置第一个顶点坐标
ctx.lineTo(100, 200)  // 设置第二个顶点坐标
ctx.lineTo(200, 200)  // 设置第三个顶点坐标
ctx.closePath()  // 将第三个顶点与第一个顶点连接起来
ctx.fill()  // 填充三角形

// 添加备注
ctx.fillStyle = 'black'
ctx.font = '14px Arial'
ctx.fillText('三角形示例', 120, 80)

6.绘制扇形
<canvas id="myCanvas" width="500" height="500"></canvas>

const canvas = document.getElementById('myCanvas')
const ctx = canvas.getContext('2d')

// 设置扇形样式
ctx.fillStyle = 'red'  // 设置填充颜色为红色

// 绘制扇形
ctx.beginPath()
ctx.moveTo(150, 150)  // 设置圆心坐标
ctx.arc(150, 150, 100, 0, Math.PI*0.5)  // 绘制扇形路径
ctx.closePath()  // 将路径闭合
ctx.fill()  // 填充扇形

// 添加备注
ctx.fillStyle = 'black'
ctx.font = '14px Arial'
ctx.fillText('扇形示例', 200, 120)

7.绘制图片
<canvas id="myCanvas"></canvas>

const canvas = document.getElementById('myCanvas')

const ctx = canvas.getContext('2d')

const img = new Image()

img.src = 'https://zk-web-object.oss-cn-qingdao.aliyuncs.com/wxy/img/6.jpg'

img.onload = function() {
    ctx.drawImage(img, 0, 0, 200, 100) // 参数(要绘制的图片, x轴, y轴, w宽度, h高度)
}
8.绘制签名画板
    <canvas id="signCanvas" width="380" height="200"></canvas>

    <button class="btn" id="clearButton">清除</button>

    const canvas = document.getElementById('signCanvas');
    const ctx = canvas.getContext('2d');
    let isDrawing = false;

    // 鼠标或触摸事件开始绘制
    canvas.addEventListener('mousedown', startDrawing);
    canvas.addEventListener('touchstart', startDrawing);

    // 鼠标或触摸事件绘制中
    canvas.addEventListener('mousemove', draw);
    canvas.addEventListener('touchmove', draw);

    // 鼠标或触摸事件结束绘制
    canvas.addEventListener('mouseup', stopDrawing);
    canvas.addEventListener('touchend', stopDrawing);
    canvas.addEventListener('mouseout', stopDrawing);

    // 清除按钮点击事件
    const clearButton = document.getElementById('clearButton');
    clearButton.addEventListener('click', clearCanvas);

    // 开始绘制
    function startDrawing(e) {
        isDrawing = true;
        const { offsetX, offsetY } = getOffset(e);
        ctx.beginPath();
        ctx.moveTo(offsetX, offsetY);
    }

    // 绘制中
    function draw(e) {
        if (!isDrawing) return;
        const { offsetX, offsetY } = getOffset(e);
        ctx.lineTo(offsetX, offsetY);
        ctx.stroke();
    }

    // 结束绘制
    function stopDrawing() {
        isDrawing = false;
    }

    // 清除画布
    function clearCanvas() {
        ctx.clearRect(0, 0, canvas.width, canvas.height);
    }

    // 获取鼠标或触摸事件的偏移量
    function getOffset(e) {
        const rect = canvas.getBoundingClientRect();
        let offsetX, offsetY;
        if (e.type.includes('touch')) {
            offsetX = e.touches[0].clientX - rect.left;
            offsetY = e.touches[0].clientY - rect.top;
        } else {
            offsetX = e.offsetX;
            offsetY = e.offsetY;
        }
        return { offsetX, offsetY };
    }
9.绘制行星运行图
    const canvas = document.getElementById('myCanvas')
    const ctx = canvas.getContext('2d')

    // 定义太阳系中行星的数据
    const planets = [
        { name: 'Sun', radius: 50, distance: 0, speed: 0, color: 'yellow' },
        { name: 'Mercury', radius: 5, distance: 100, speed: 0.02, color: 'gray' },
        { name: 'Venus', radius: 8, distance: 150, speed: 0.015, color: 'orange' },
        { name: 'Earth', radius: 10, distance: 200, speed: 0.01, color: 'blue' },
        { name: 'Spark', radius: 7, distance: 242, speed: 0.008, color: 'red' }
    ]

    // 动画循环
    function draw() {
        ctx.clearRect(0, 0, canvas.width, canvas.height)

        // 绘制太阳
        ctx.beginPath()
        ctx.arc(canvas.width / 2, canvas.height / 2, planets[0].radius, 0, Math.PI * 2)
        ctx.fillStyle = planets[0].color
        ctx.fill()

        // 绘制行星和轨道
        for (let i = 1; i < planets.length; i++) {
            const planet = planets[i]
            planet.angle = (planet.angle || 0) + planet.speed

            const x = canvas.width / 2 + planet.distance * Math.cos(planet.angle)
            const y = canvas.height / 2 + planet.distance * Math.sin(planet.angle)

            // 绘制轨道
            ctx.beginPath()
            ctx.arc(canvas.width / 2, canvas.height / 2, planet.distance, 0, Math.PI * 2)
            ctx.strokeStyle = '#999'
            ctx.stroke()

            // 绘制行星
            ctx.beginPath()
            ctx.arc(x, y, planet.radius, 0, Math.PI * 2)
            ctx.fillStyle = planet.color
            ctx.fill()
        }

        requestAnimationFrame(draw)
    }

    // 启动动画
    draw()
四、canvas应用场景
| 领域 | 描述 |
|---|---|
| 游戏开发 | 创建2D和3D游戏,绘制游戏场景、角色和动画效果 |
| 数据可视化 | 绘制交互式的数据可视化图表和图形,呈现数据分析和趋势 |
| 图像处理 | 图像编辑、转换和操作,应用滤镜效果、裁剪和调整图像大小 |
| 图形绘制和绘画 | 创建绘画应用、图形编辑器和图形设计工具,实现图形绘制和编辑功能 |
| 用户界面 | 创建自定义的用户界面元素和动画效果,实现交互式用户体验 |
| 广告和营销 | 创作吸引人的广告和营销内容,展示产品特点和实现交互式广告体验 |
五、canvas实现小游戏
贪吃蛇
http://zk-web-object.oss-cn-qingdao.aliyuncs.com/wxy/canvas/game01.html
俄罗斯方块
https://zk-web-object.oss-cn-qingdao.aliyuncs.com/wxy/canvas/game02.html


 1万+
1万+


 被折叠的 条评论
为什么被折叠?
被折叠的 条评论
为什么被折叠?
 到【灌水乐园】发言


